Written by: Stephen Zhai — Sales Manager, HSD Optical
Published: August 2026 | Read time: 6 min
When a relay train comes out soft at final assembly, the first instinct is to blame the last part in the line. More often, the answer is already on paper — in the surface maps that shipped with the batch.
Every rod “passed” inspection on paper. No single part was out of spec. Still, the image was soft. That is the scenario that made us start printing measured values — PV, RMS, centration — on every batch COA instead of a “within spec” checkbox.
If you have ever chased a soft image through six rods and an entire afternoon, this one is for you.
Surface Figure Is Where a Relay Is Won or Lost
An endoscope relay is a chain of lenses. Each surface contributes a small wavefront error, and those errors do not cancel — they accumulate. By the time the light has passed six to ten rods, a few arc-minutes of centration and a few tenths of a wave of surface figure per part become a visibly soft image.
The problem cannot be fixed downstream. By the time you see it at final assembly, the defect has already been sealed inside the system. The only place it can be caught is where the surfaces are made and measured.
The surface map is where this is won or lost.
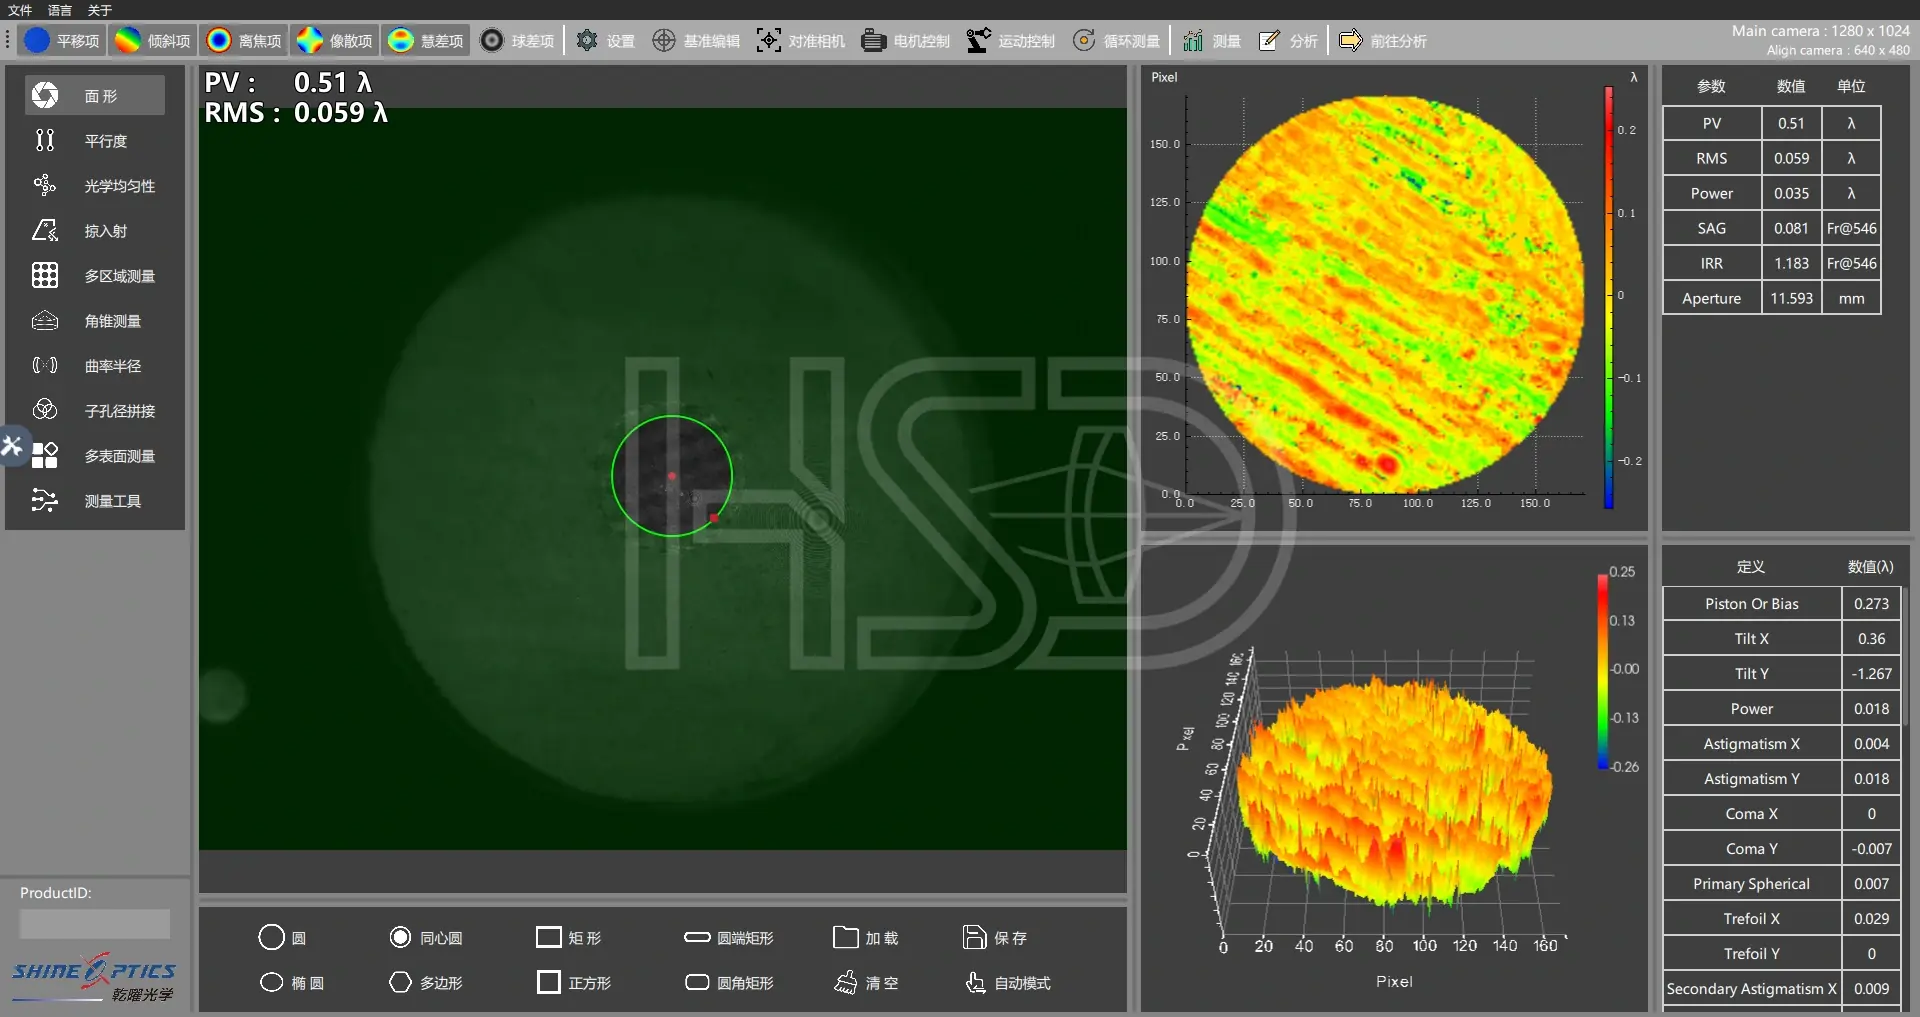
PV and RMS: Two Numbers, Two Different Stories
An interferometer compares your surface against an ideal reference and draws the height deviation as a color map. A full color cycle is roughly half a wavelength of surface height; at the 632.8 nm test wavelength, 1λ ≈ 0.63 µm.
PV (peak-to-valley) is the height difference between the highest and lowest points on the measured surface. It describes the worst case: one pit, chip or scratch pulls PV up even when the rest of the surface is clean.
RMS (root mean square) is the square root of the mean of the squared deviations. It describes the overall surface quality: a hundred points each off by 0.01λ give a higher RMS than one point off by 0.5λ, but a much lower PV.
That is why we report both. High PV with low RMS means a localized defect. Moderate PV with higher RMS means broad form error. Low PV and low RMS means a genuinely clean surface. Reading one without the other misses half the story.
What We Actually Do
- Interferometric surface testing on production parts — surface figure measured in the workshop, not on a sample that was polished specially.
- Measured values on the batch COA — PV, RMS and centration as real numbers, not a “conforms” checkbox.
- Rejects become process feedback — striation direction, scratch patterns and spoke defects go back to the polishing floor, so we fix the cause, not just the part.
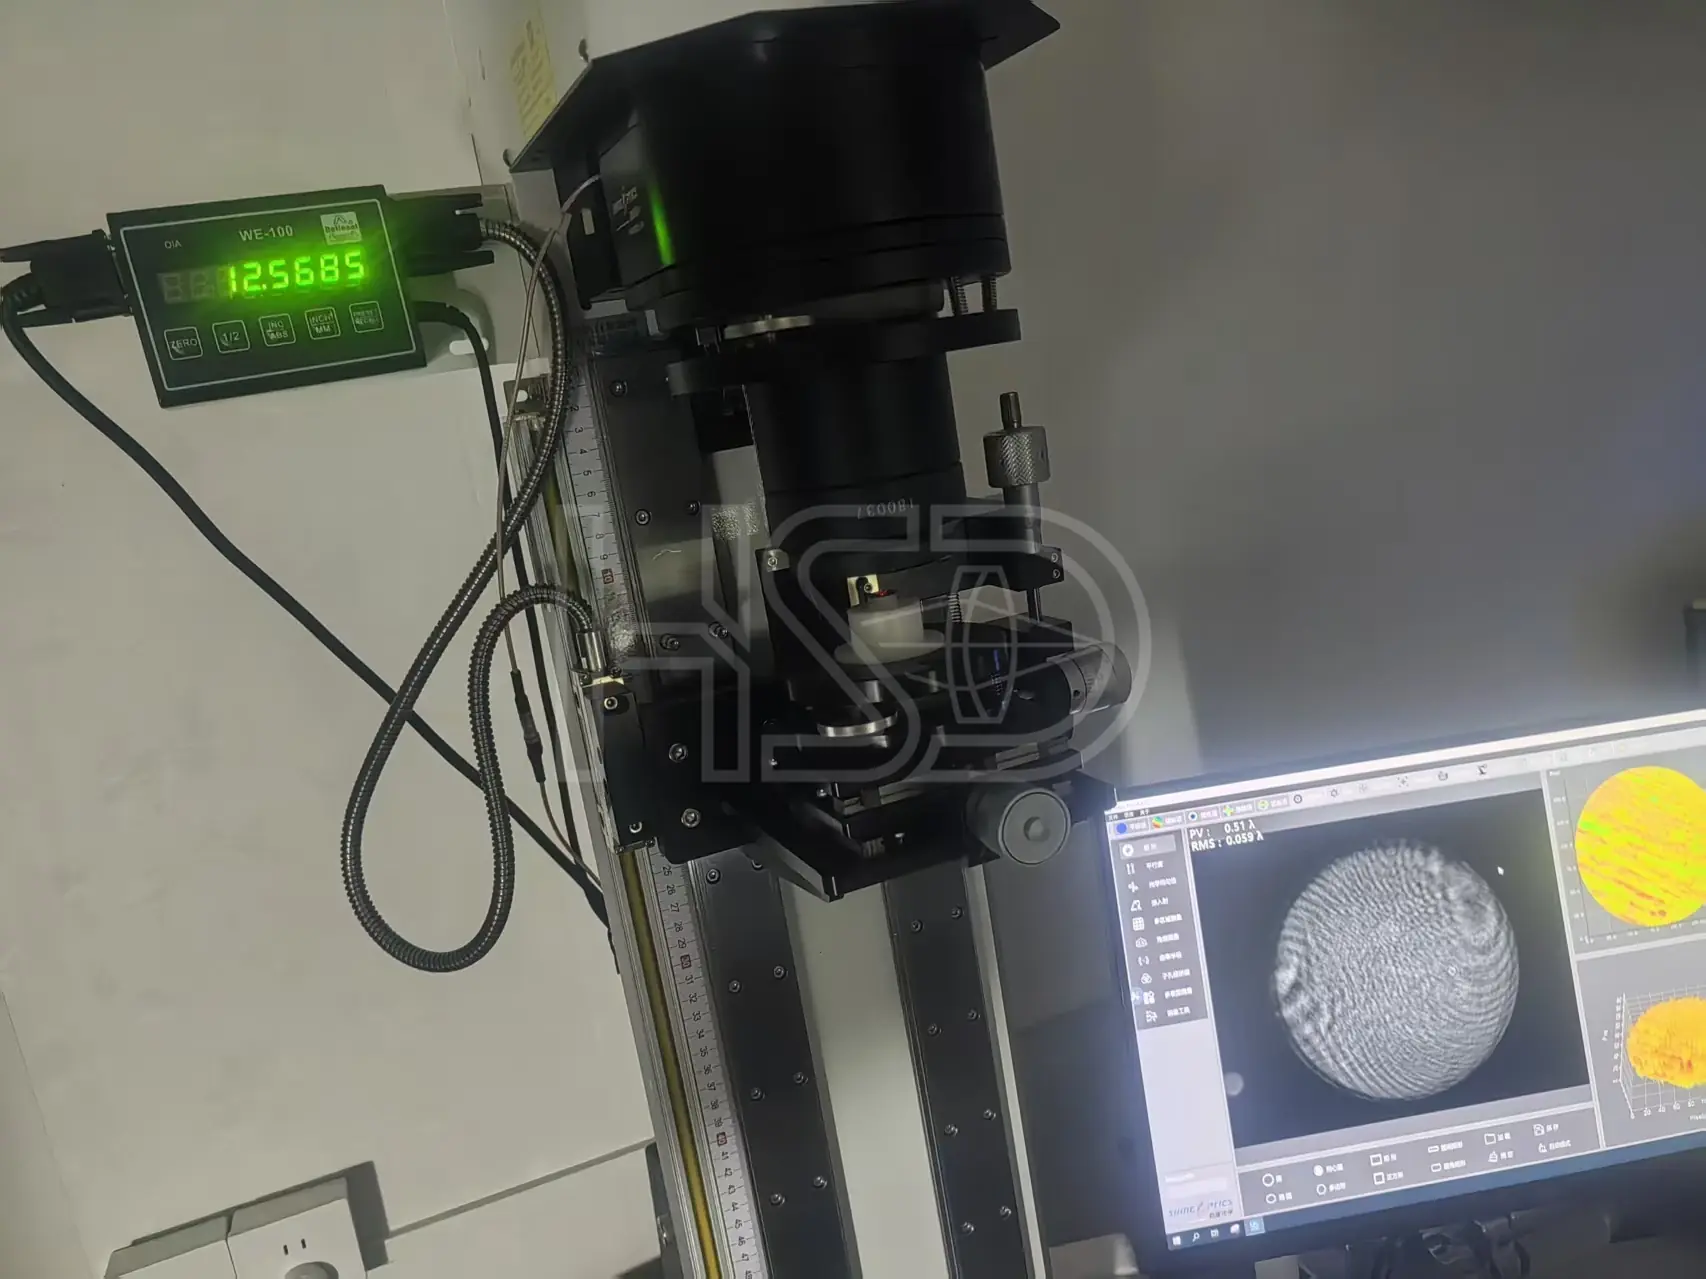
Specs That Actually Matter When You’re Buying
| Spec | What to Demand |
|---|---|
| Surface figure (PV) | A measured PV per batch at a stated test wavelength (typically 632.8 nm). Ask what wavelength the number refers to. |
| Surface figure (RMS) | RMS alongside PV. PV catches single defects; RMS tells you about overall quality. Demand both. |
| Centration | Measured centration per batch, typically ≤3′ for rod lenses, with the actual reading on the COA. |
| Scratch-dig | 40/20 per MIL-PRF-13830B is the common baseline for endoscope optics. Confirm the inspection method. |
| COA format | Measured values per batch, not “conforms to drawing.” A COA you can audit is worth more than one you can’t. |
What Defects Actually Look Like: A Real Gallery
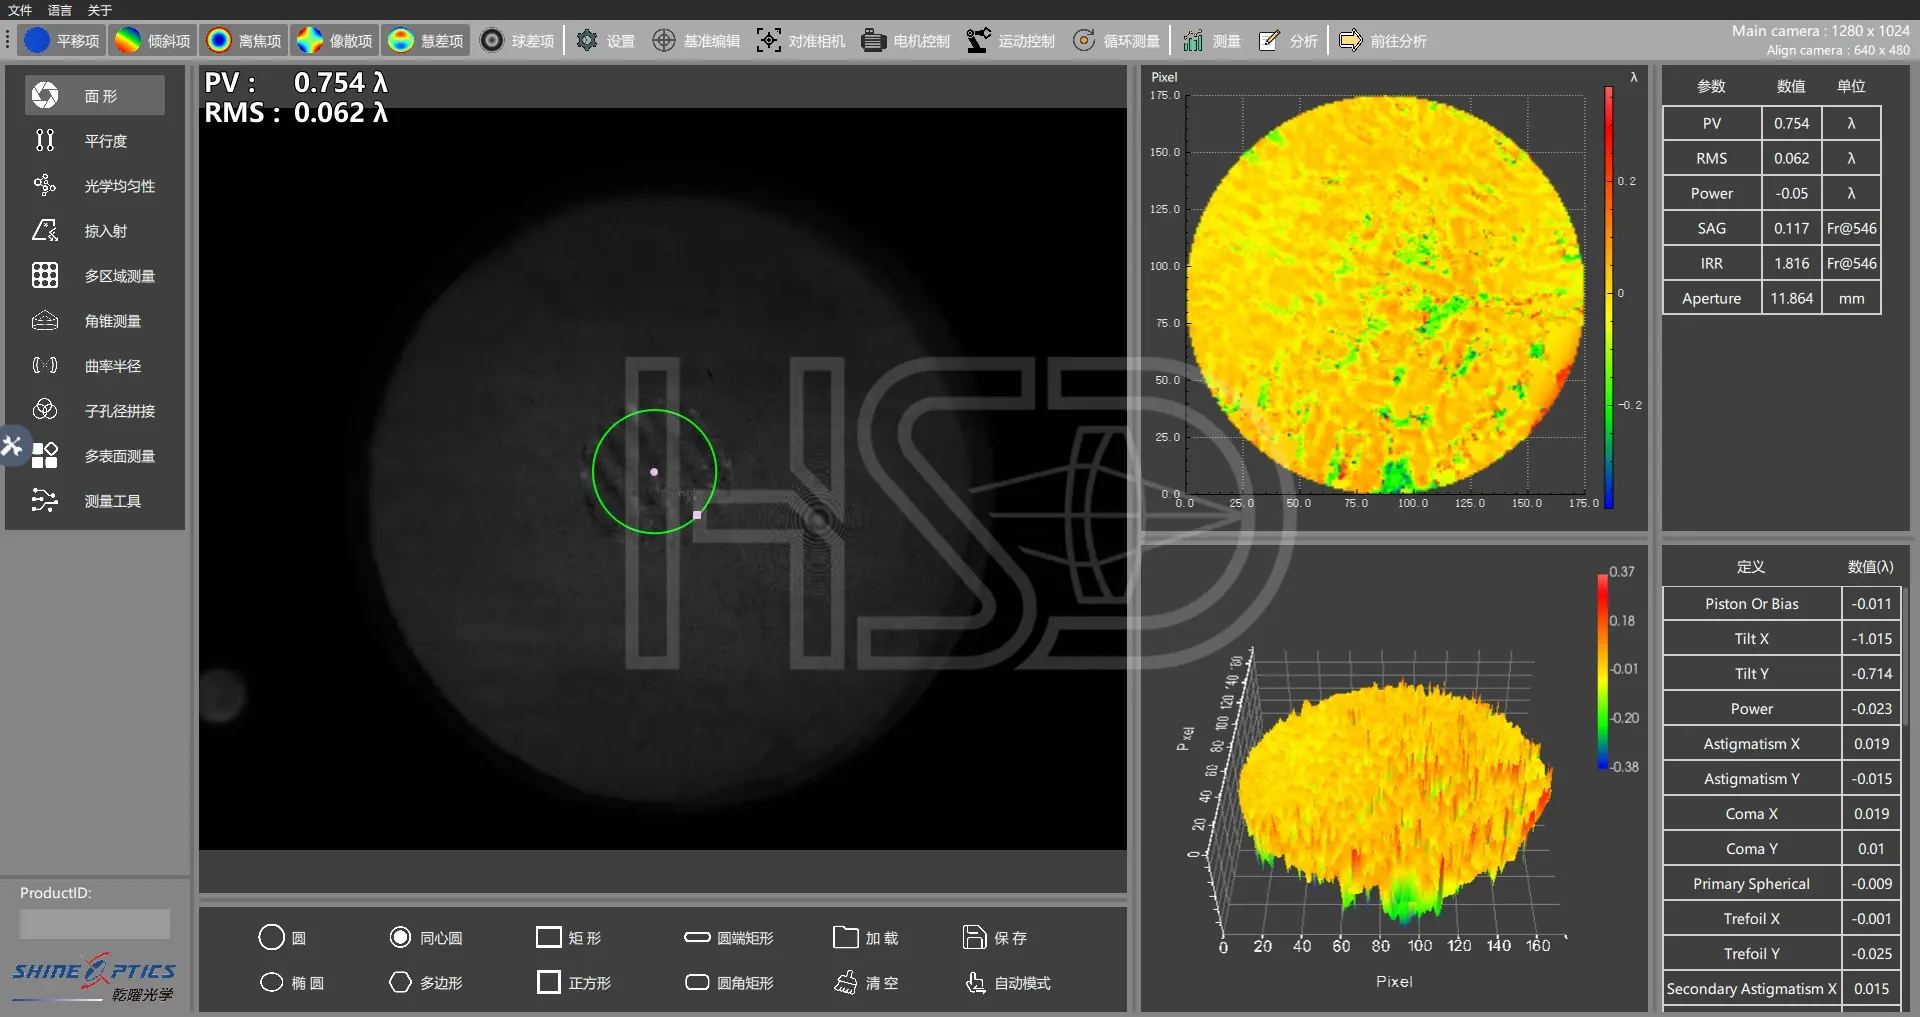
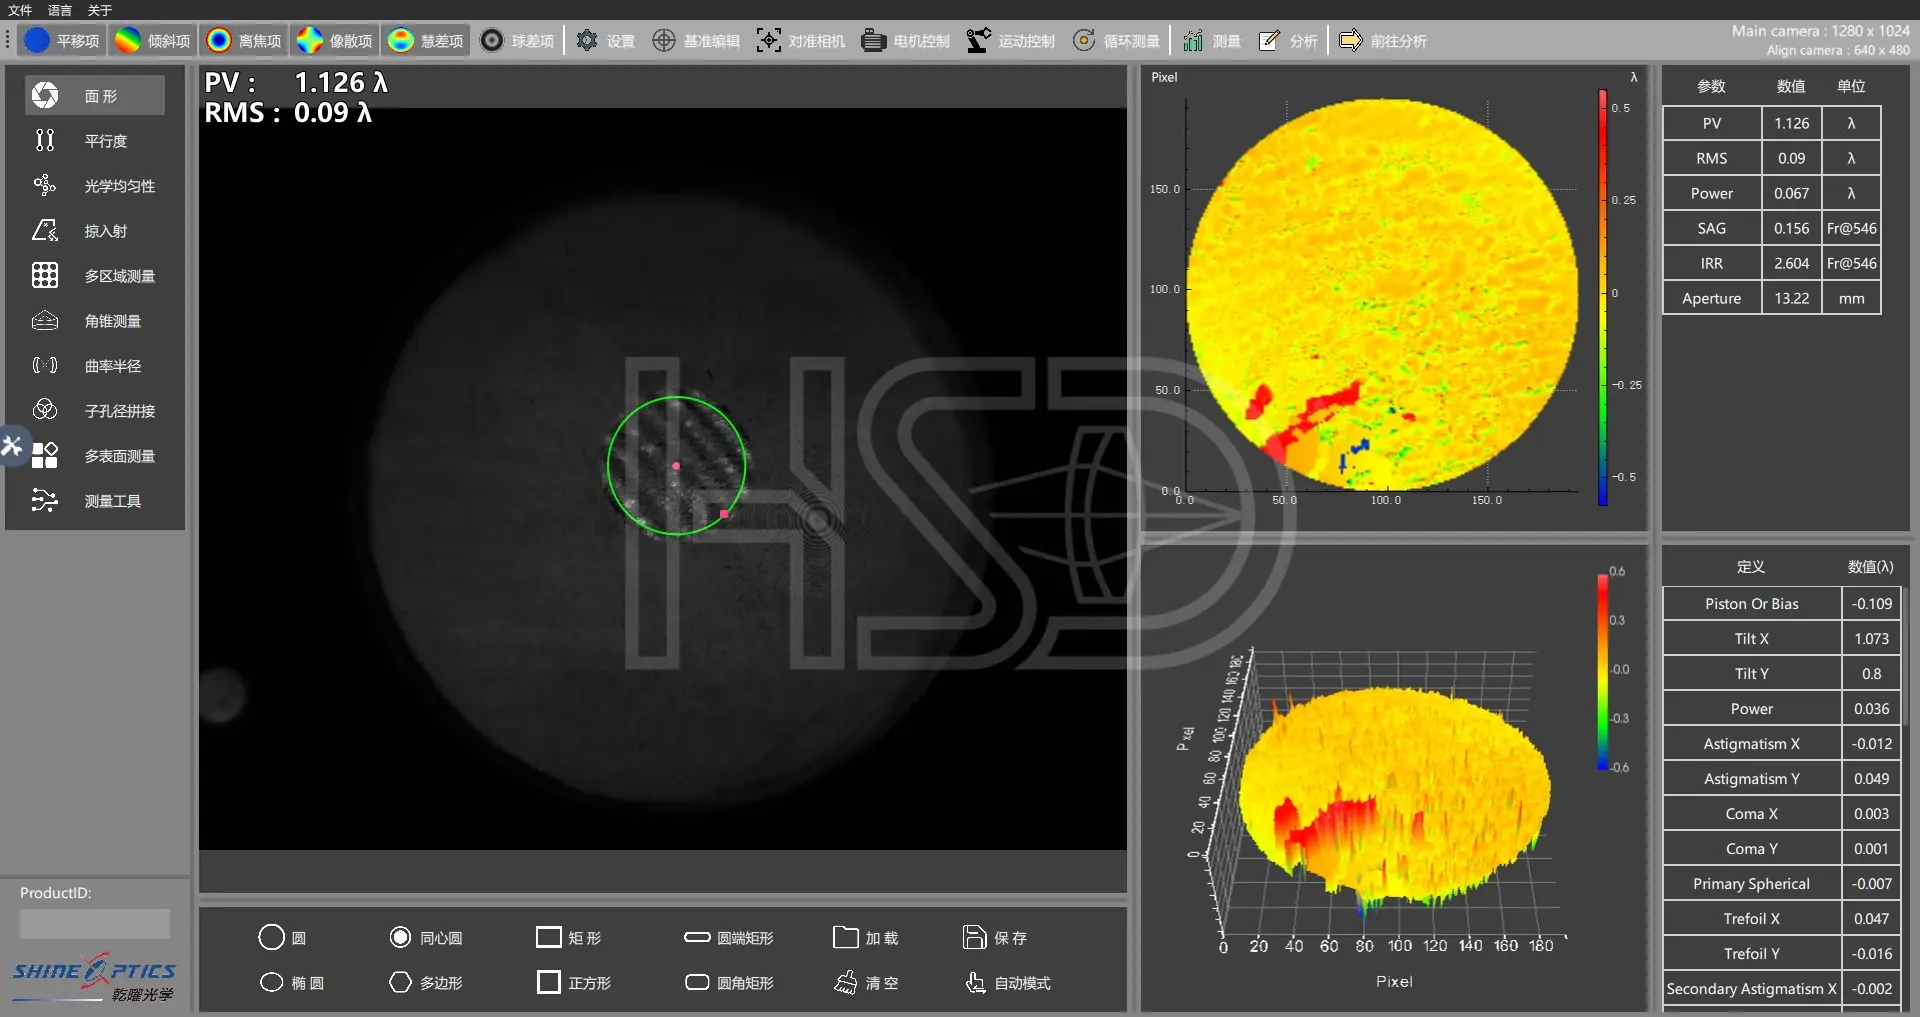
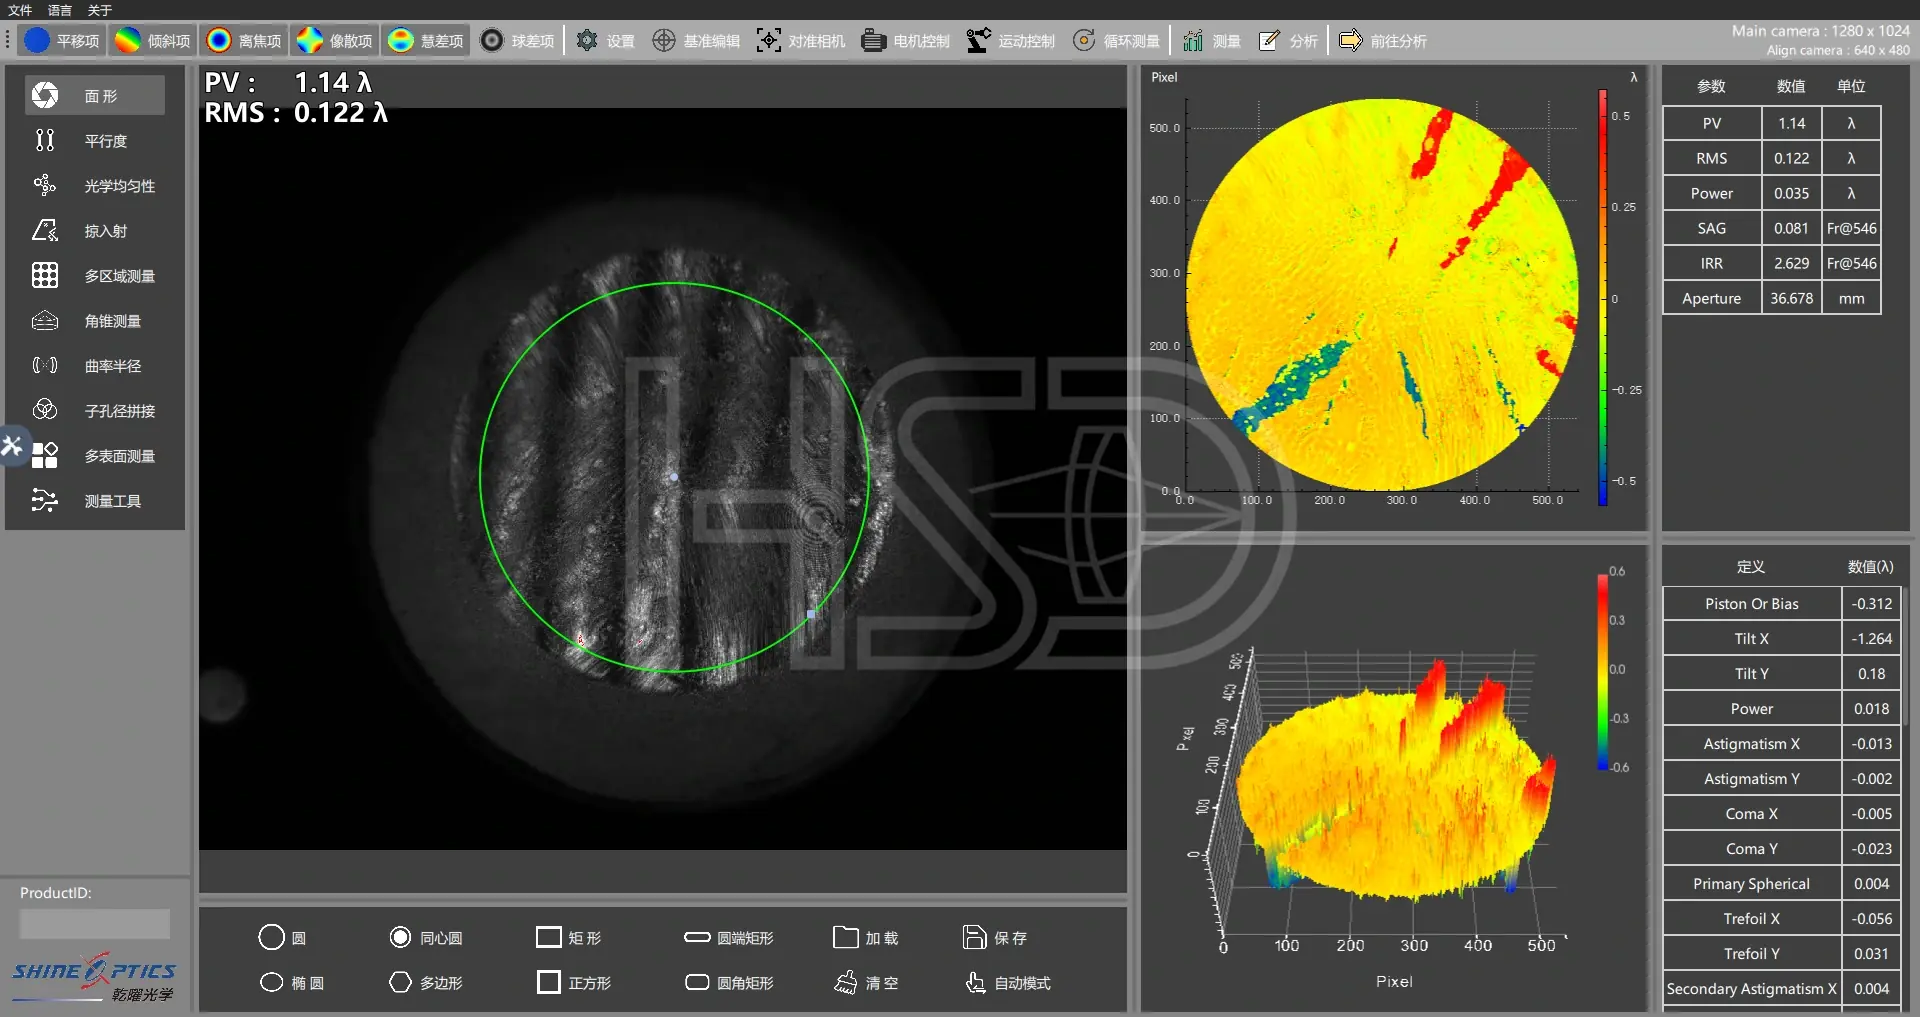
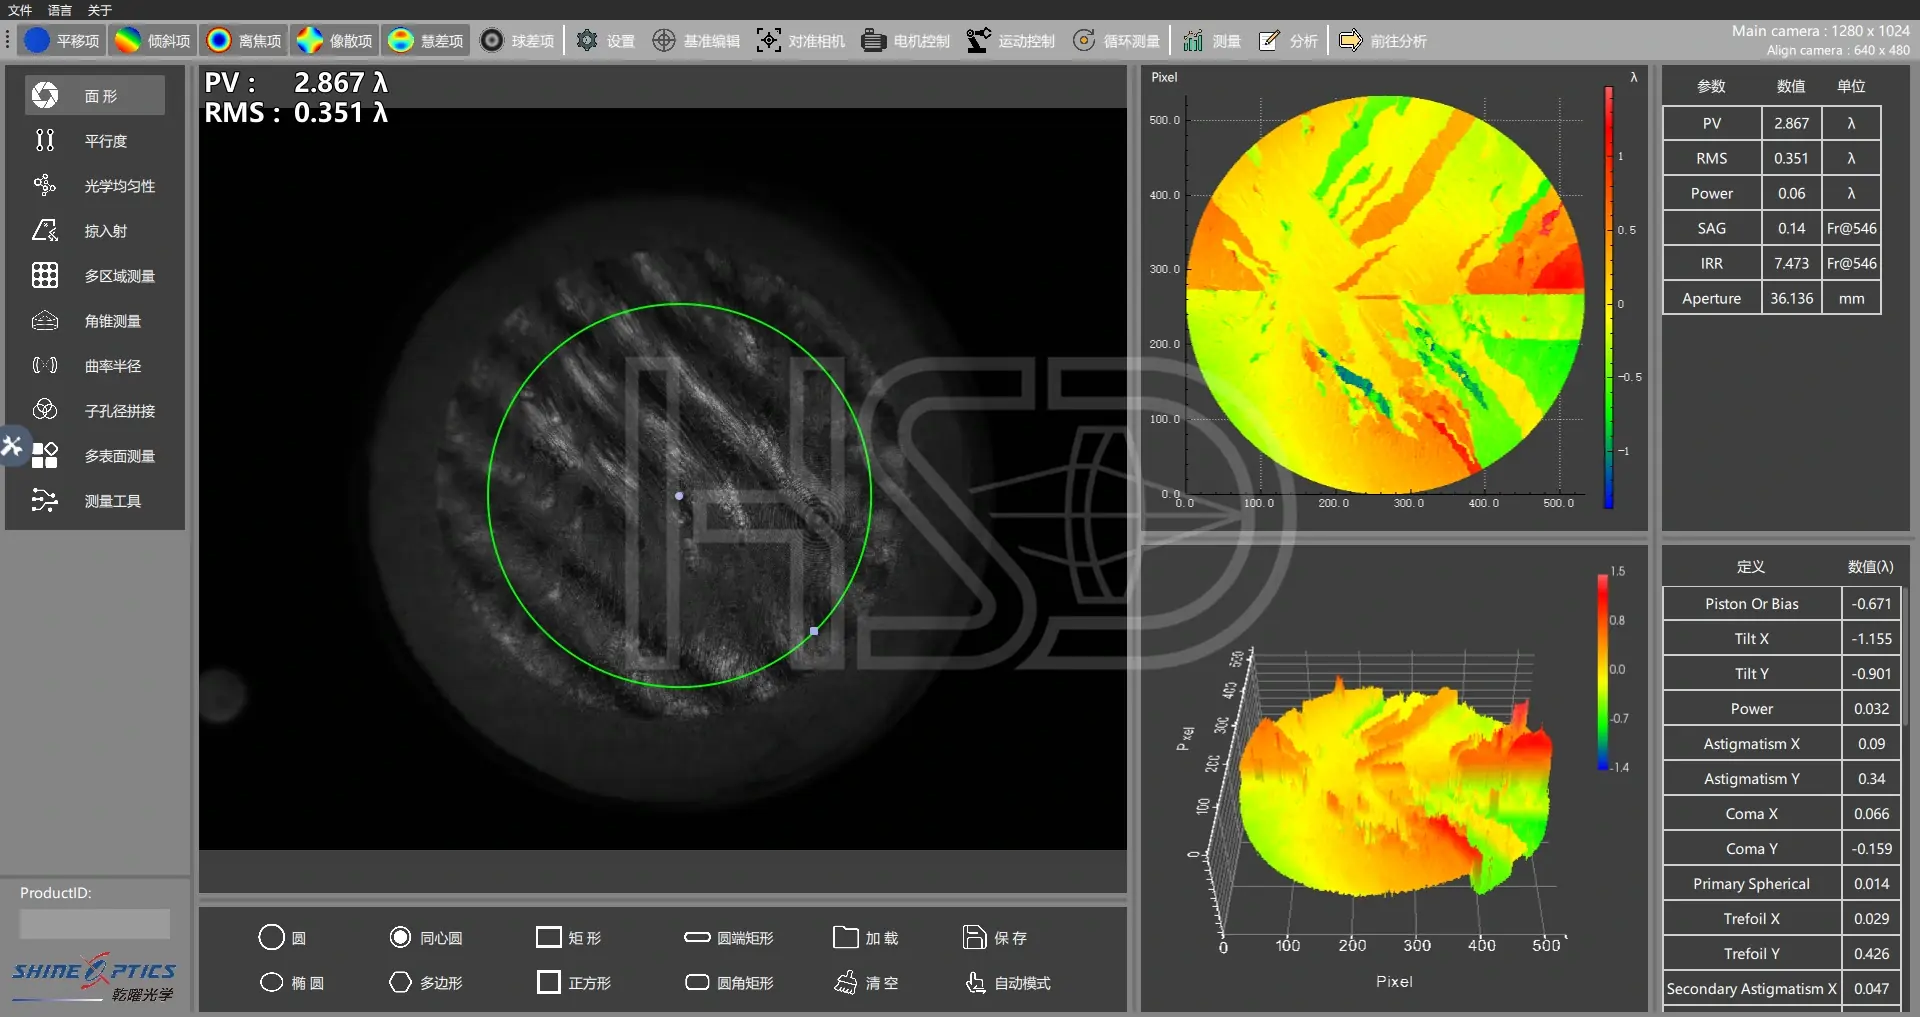
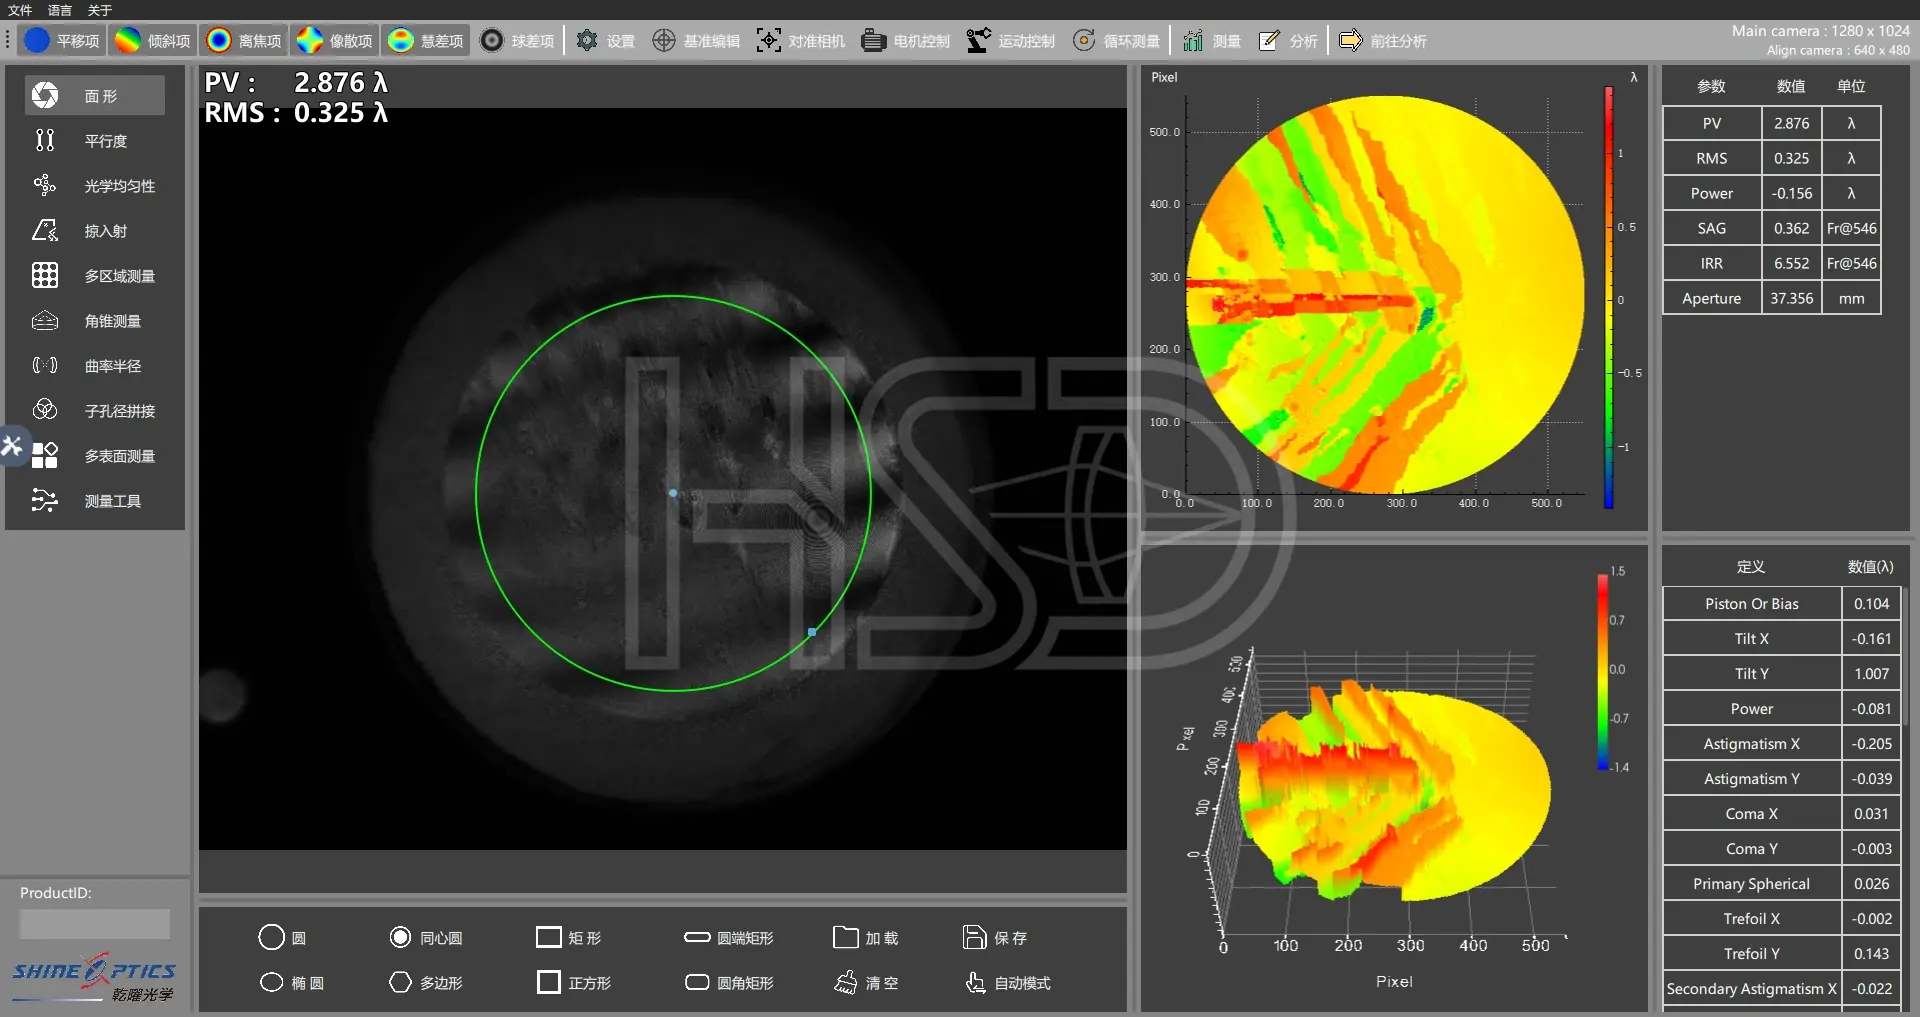
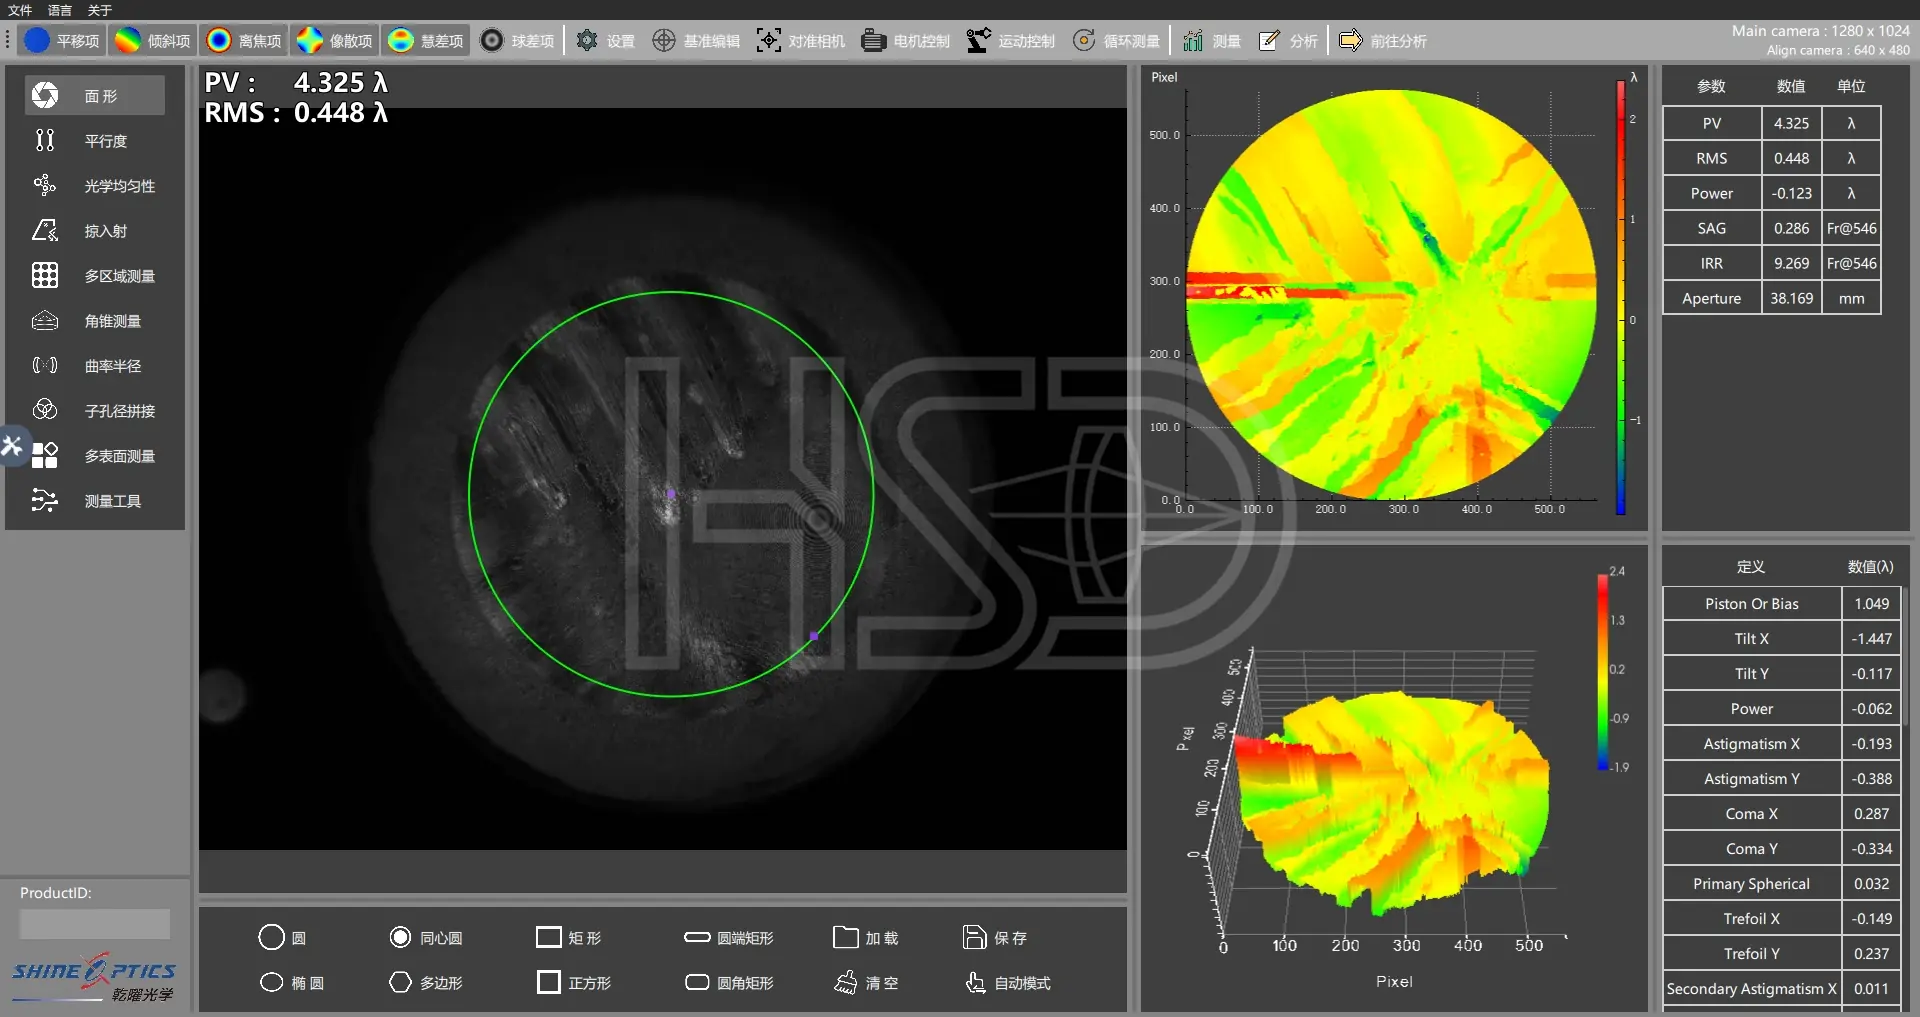
Every map below is a part our inspection caught and rejected. These are not diagrams and not stock images — they are saved measurement outputs from production runs. This is what “we test every batch” looks like in practice.
Form and waviness
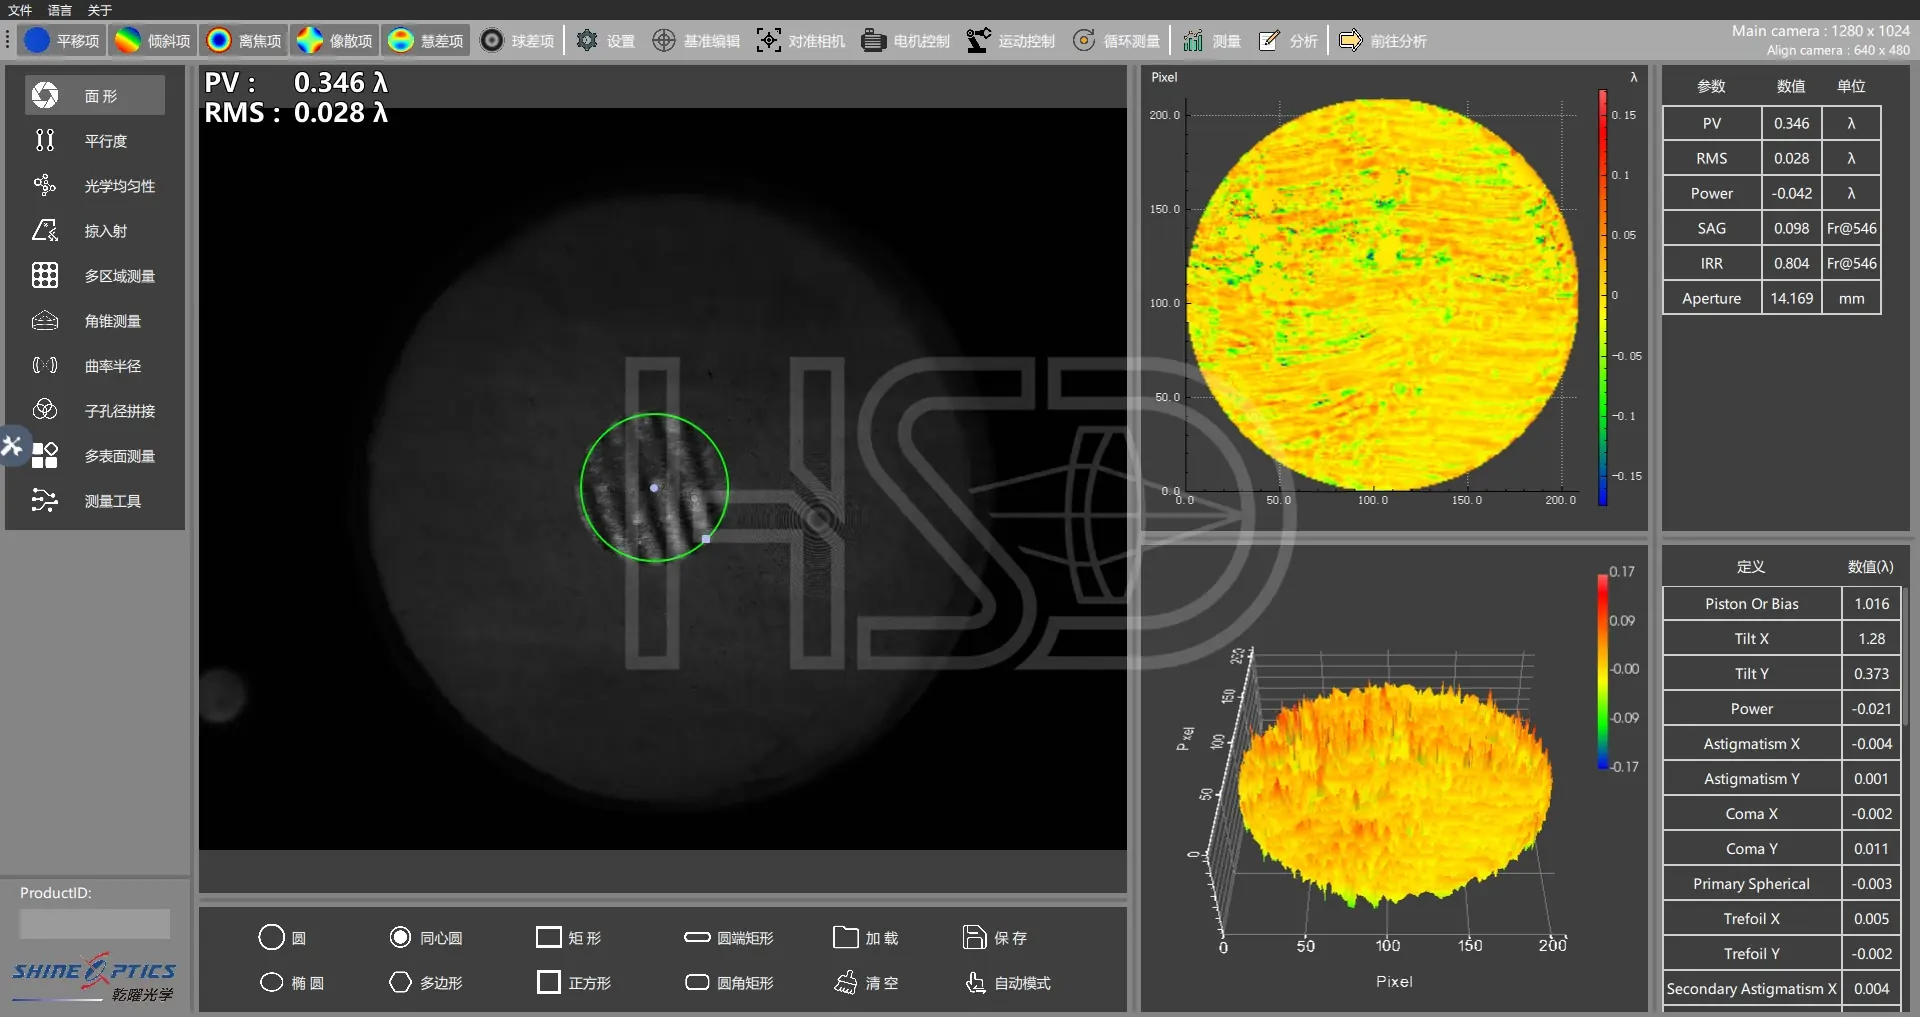
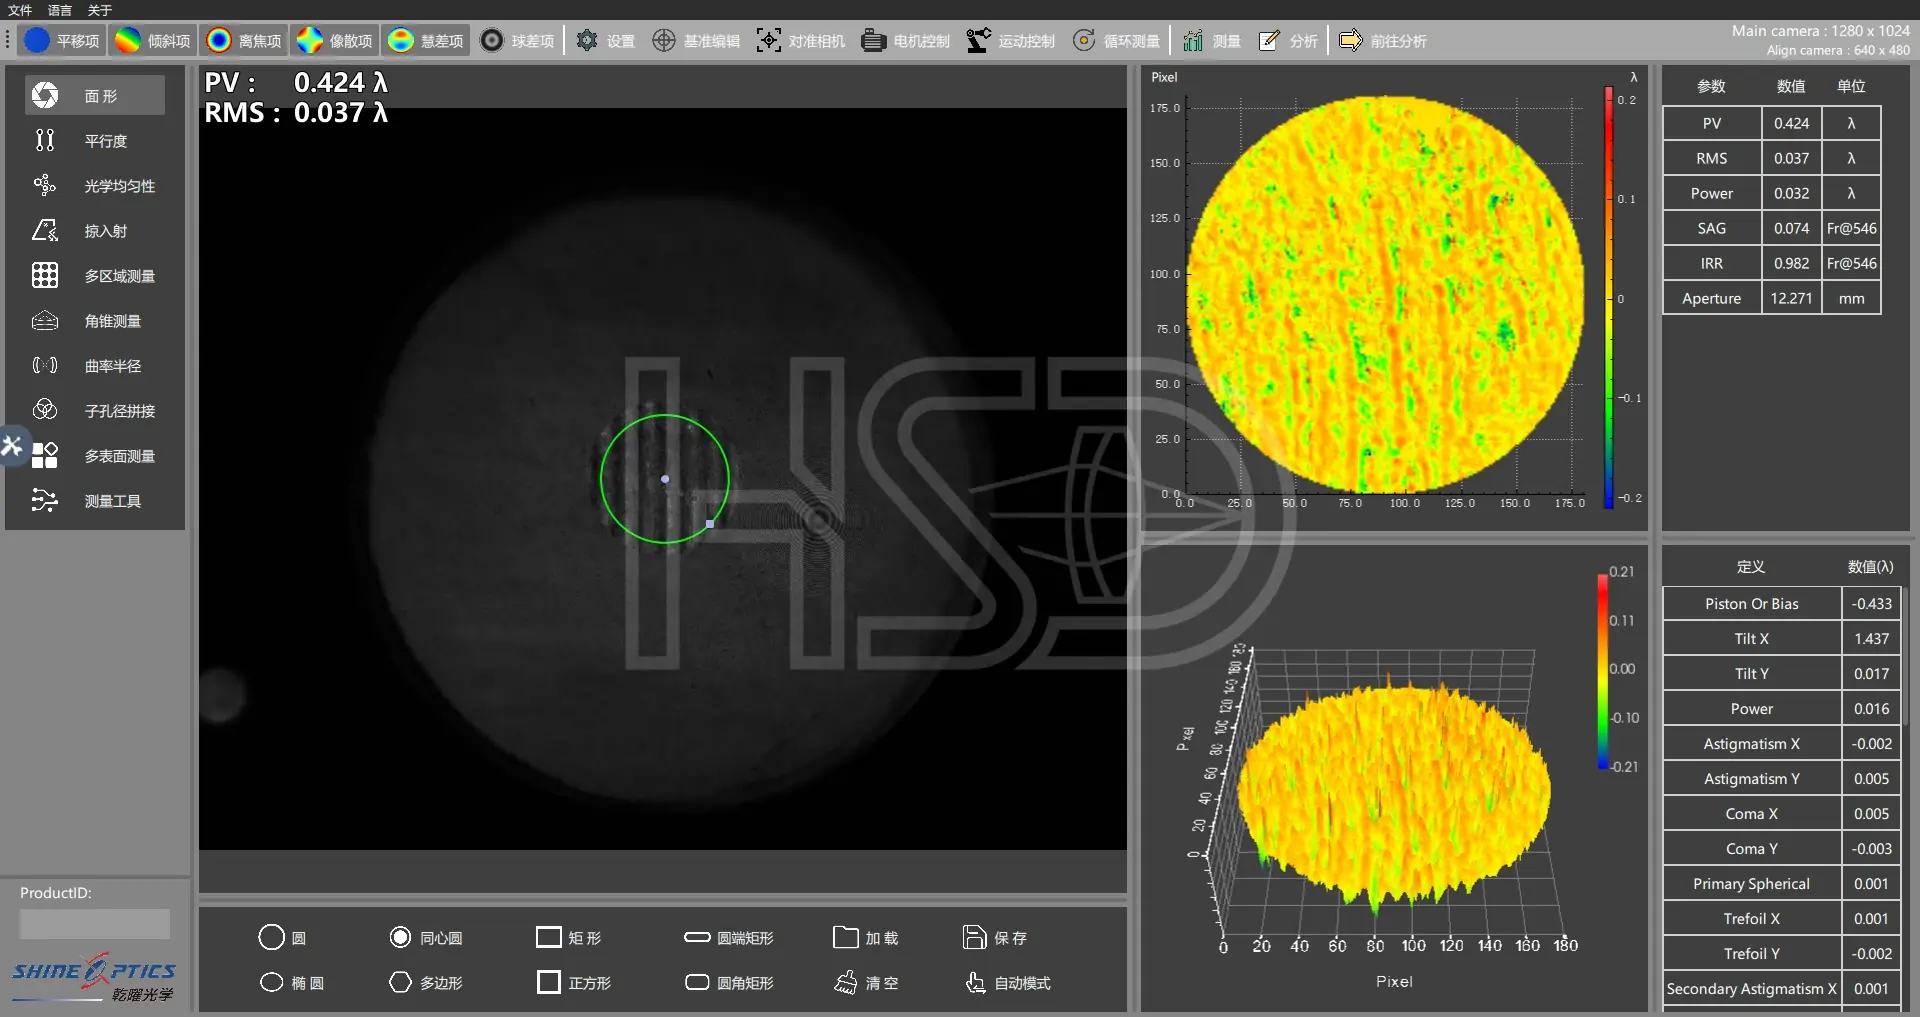
Localized defects
Scratches and striation defects
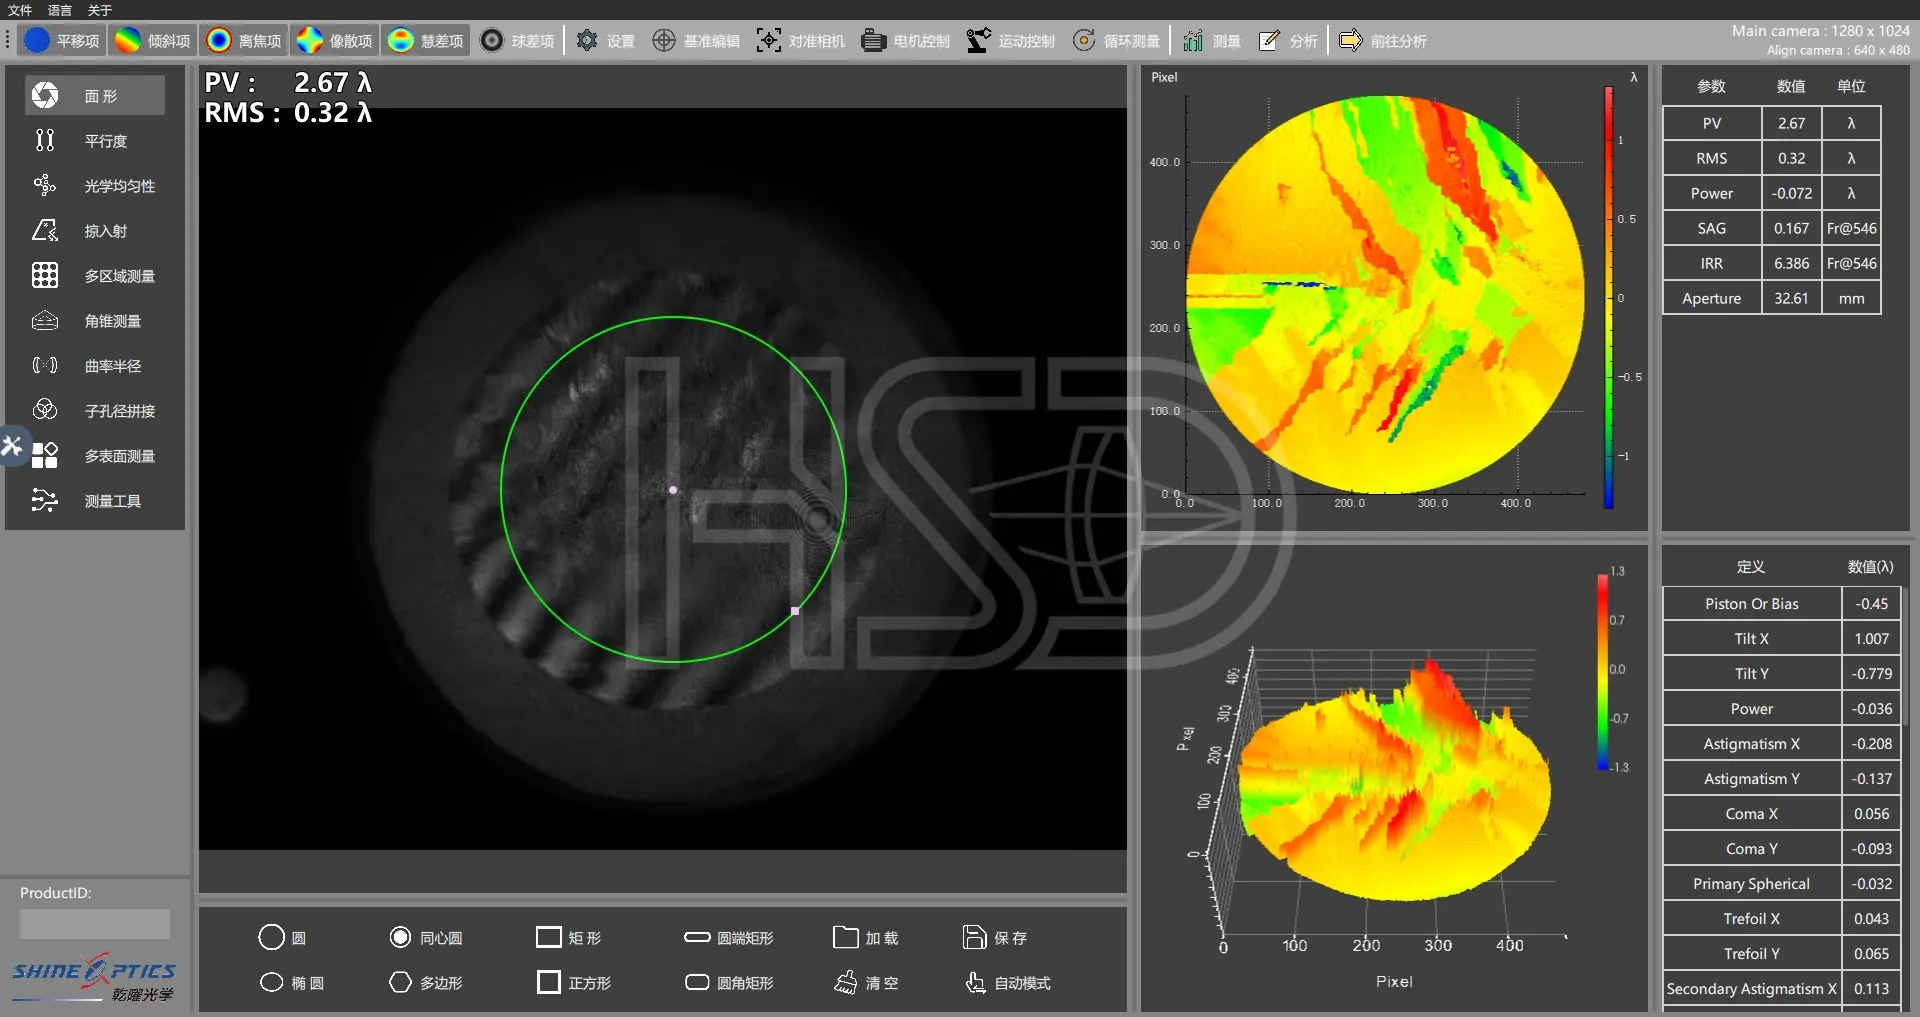
Spoke defects
What the Records Actually Give You
- Faster incoming inspection — your QC compares against real numbers instead of trusting a “passed” stamp.
- Disputes that resolve in minutes — the map shows whether the part shipped with that defect, or whether it was damaged in handling.
- Process feedback that compounds — defect patterns trace back to polishing, mounting or material, so the next batch is better, not just the rejection pile.
Ready to Test Us?
Send us your drawing. We will confirm the process and tell you exactly which measured values will be on the COA — usually within 24 hours.
If you want an NDA first, that is standard.
FAQ — Interferometry Questions, Answered
What is PV in surface measurement?
PV (peak-to-valley) is the height difference between the highest and lowest points on a measured surface, usually quoted in wavelengths (λ). At a 632.8 nm test wavelength, 1λ ≈ 0.63 µm. PV describes the worst point on the surface.
What is RMS and why does it matter?
RMS is the root mean square of all height deviations from the reference surface. It describes overall quality. A single scratch can make PV look terrible while RMS stays low — which is why you need both numbers.
What does PV 0.5λ mean in real numbers?
At 632.8 nm, PV 0.5λ is roughly 0.32 µm of peak-to-valley error. For reference, the passing surface shown in this post is PV 0.51λ with RMS 0.059λ (≈0.037 µm).
What PV/RMS should I demand for rod lenses?
It depends on your drawing and the relay design. Relay rods in the Φ1.2–8.0 mm range are commonly specified around 0.25–0.5λ PV. Demand a measured value at a stated wavelength and let your system design set the limit.
How do you measure centration?
On a centration station, typically ≤3′ for our rod lenses, with the actual reading recorded per batch. The COA carries the measured value, not a “within spec” claim.
Do you test every batch?
Yes. Interferometric surface testing and centration measurement are part of batch release, and the measured values go on the COA. Sampling policy is confirmed against your drawing at quote stage.
Can you measure the surface of my specific lens?
Yes — send the drawing and we will include the measurement plan in the review: which parameters, which equipment, and what will appear on the COA.
Will you share measurement records before we order?
Yes. Ask for a sample COA format with your quote. NDA is standard before any technical discussion if you prefer.
About HSD Optical
HSD Optical is a Tier 2 precision optical manufacturer in Nanjing, China, founded in 2009, ISO 9001:2015 certified. We make uncoated rod lens blanks for coating laboratories and finished rod lenses and micro lenses for endoscope and ureteroscope assemblers. Rod lenses Φ1.19–8.0 mm, centration ≤3′, measured COA per batch.
Related
- Rod Lenses — Product Hub
- Micro Lenses — Product Hub
- Rod Lenses for Rigid Endoscopes
- Ureteroscope Micro Lenses
- Contact Engineering
Specifications subject to confirmation at inquiry. HSD Optical — ISO 9001:2015.