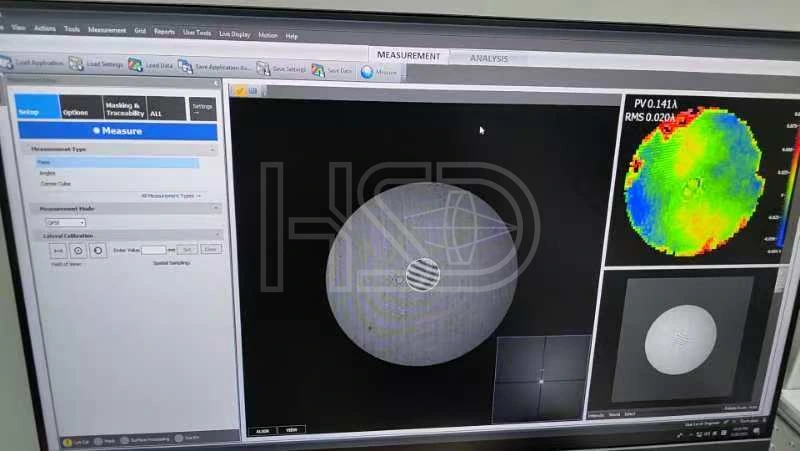
Surface Figure
Surface form tested by interferometry — PV/RMS values from the actual measurement.
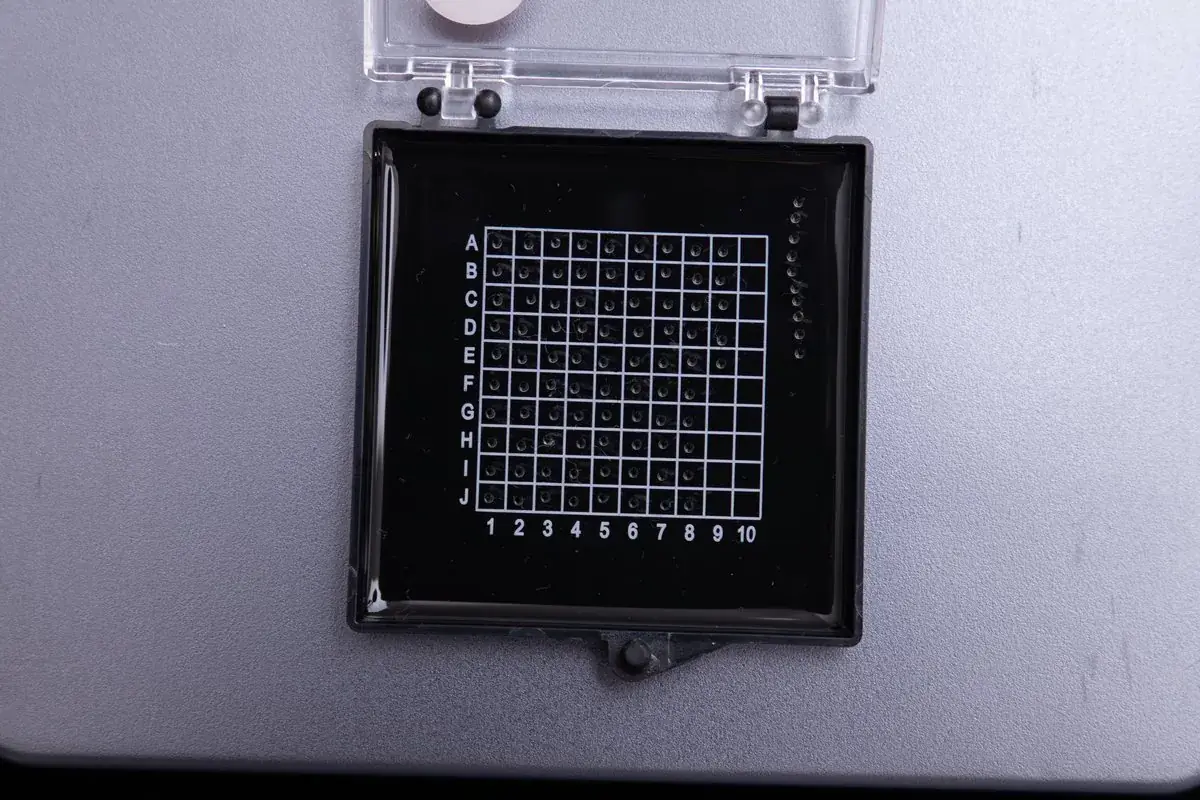
1 · A micro lens with centration error shifts the image center. At Φ1.0 mm, a few arc-minutes of centration error moves the image center visibly.
How HSD avoids it: centration is verified on a per-batch sampling plan, and the measured values — not a pass/fail claim — go on the COA.
2 · Micro fit tolerances are unforgiving. −0.005/−0.012 mm on diameter is a fit tolerance for ultra-slim tube assemblies; drift breaks the fit with no visible defect.
How HSD avoids it: diameter and thickness are verified on a per-batch sampling plan; the values go on the COA.
3 · The “manufacturer” may be a trader. When drawings move through several shops, nobody can explain a yield problem.
How HSD avoids it: we are the factory — a 30-person precision optical workshop in Nanjing; your drawing stays with our engineers.
4 · Batch drift can't be traced. A COA that only says “within spec” hides lot-to-lot shifts.
How HSD avoids it: every batch COA carries measured values — dimensions, centration, surface, test method.
A micro lens line works when every batch carries the same tolerances and the same numbers on paper.
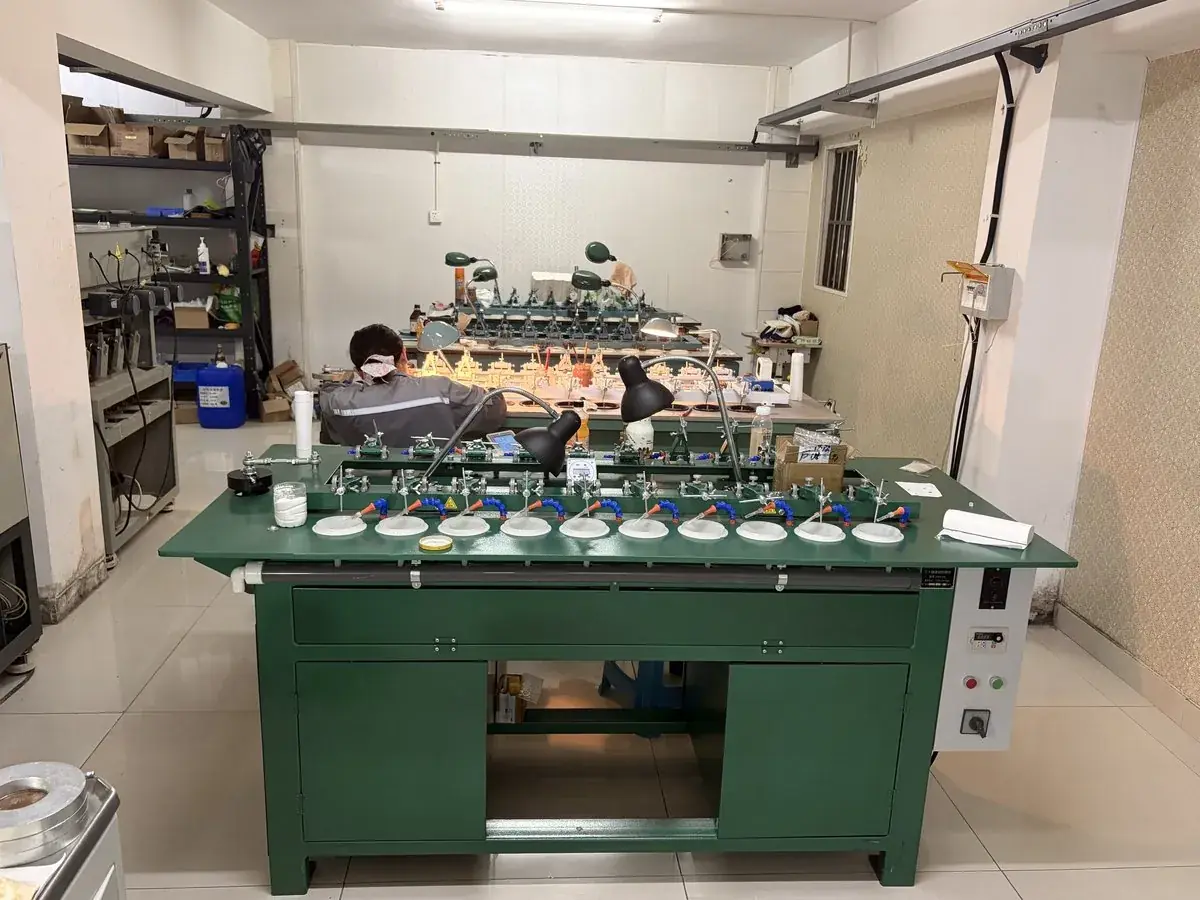
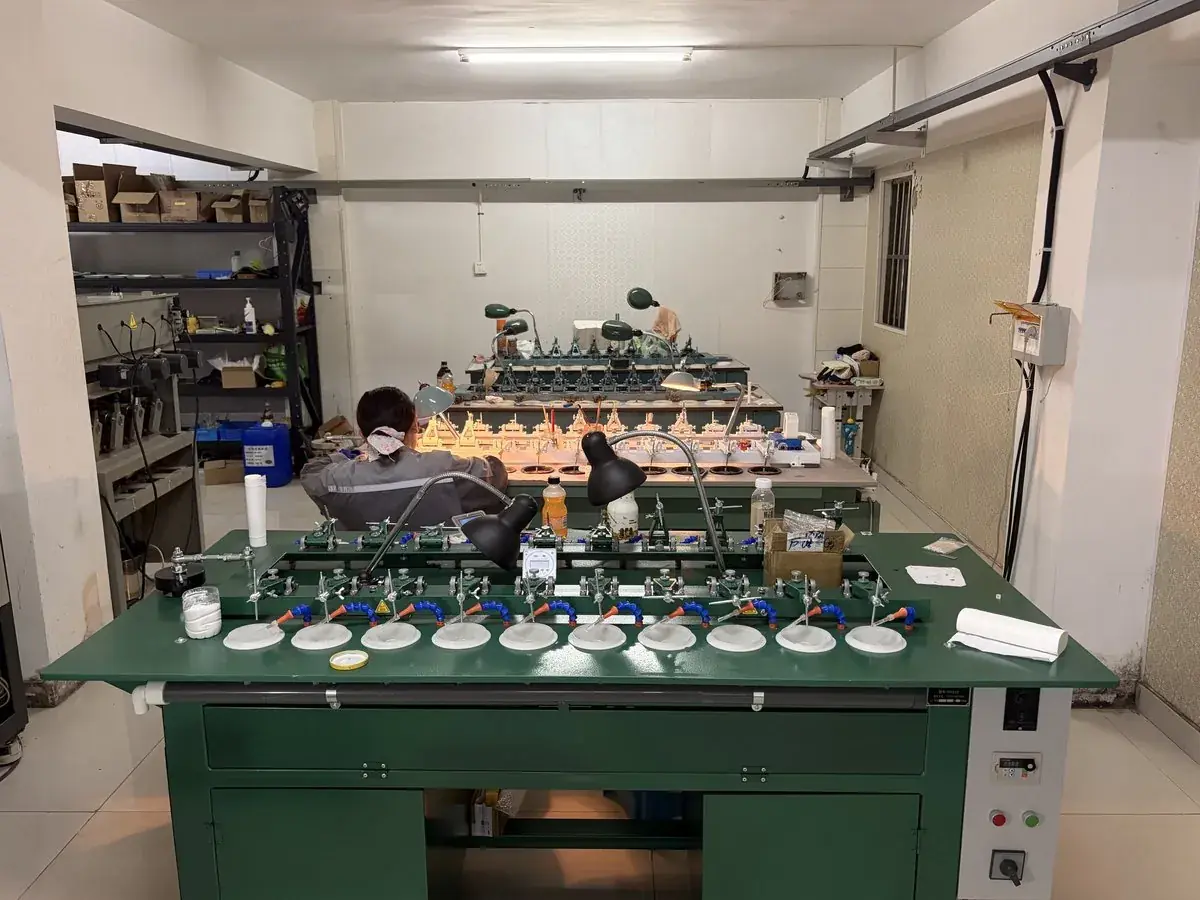
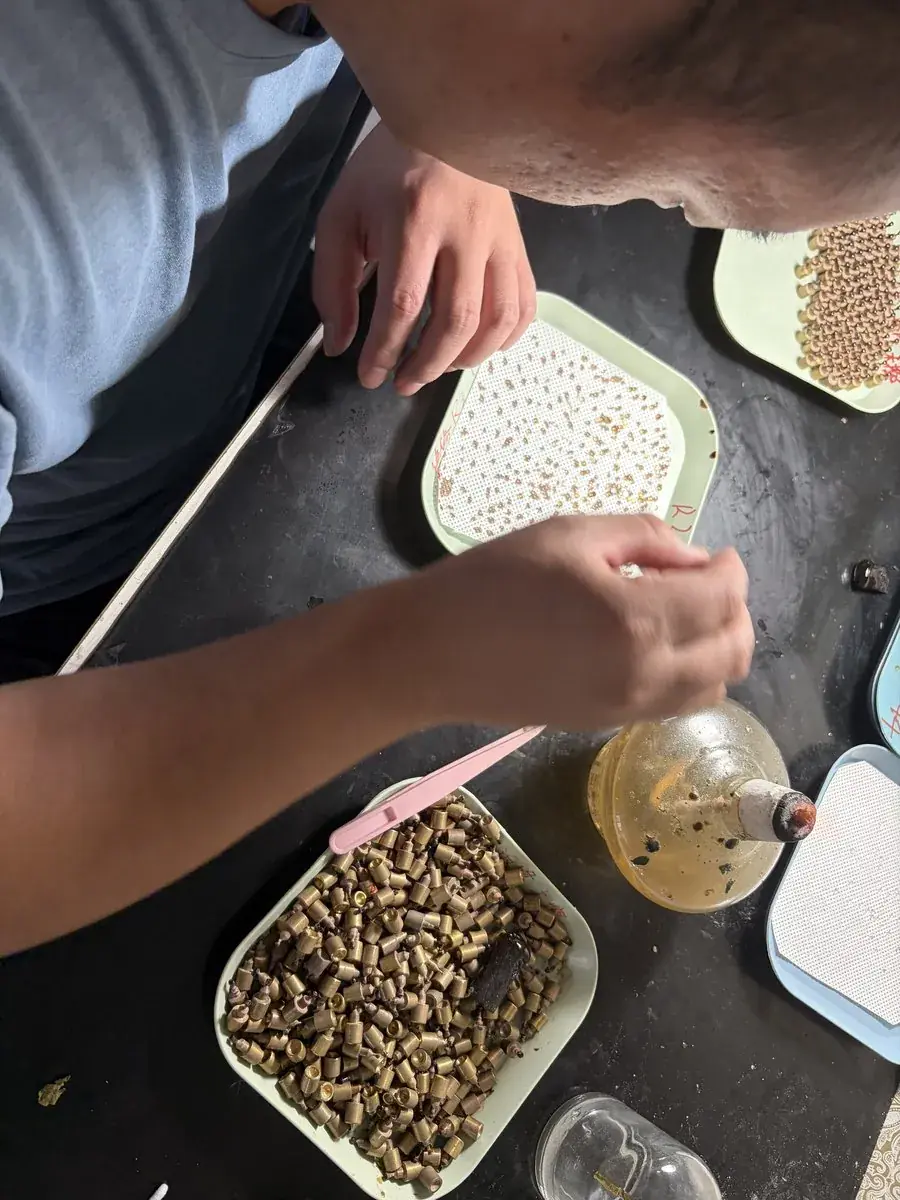
Our own micro lens line — grinding, polishing, centration and inspection. Customer designs are never displayed.
| Item | Specification |
|---|---|
| Types | PCV / PCX, per drawing |
| Diameter | Φ0.33–3.8 mm |
| Diameter tolerance | −0.005 / −0.012 mm |
| Thickness tolerance | ±0.01–±0.02 mm |
| Centration | ≤3′, tighter per drawing |
| Surface quality | 40/20 · MIL-PRF-13830B / ISO 10110-7 5/40-20 |
| Edge chipping | ≤0.05 mm, per drawing · ISO 10110-7 E 0.05 |
| Coating | Uncoated blanks, or AR 400–700 nm (per drawing) |
You send the drawing, we make the micro lenses — NDA protected, MOQ 10. If we can't do it, we'll tell you why.
Send Your Drawing →Email [email protected]Application context
Cystoscope micro lenses use compact PCV/PCX forms in the Φ0.33–3.8 mm range, made to drawing with centration ≤3′.
Check on the drawing: diameter, thickness, radius and edge treatment.
We prefer the drawing; a sample can be measured and quoted as a reference.
Inspection & Metrology
Every batch is verified with interferometry, centration measurement and surface inspection. You get the actual measured values, not a “within spec” checkbox.
Surface form tested by interferometry — PV/RMS values from the actual measurement.
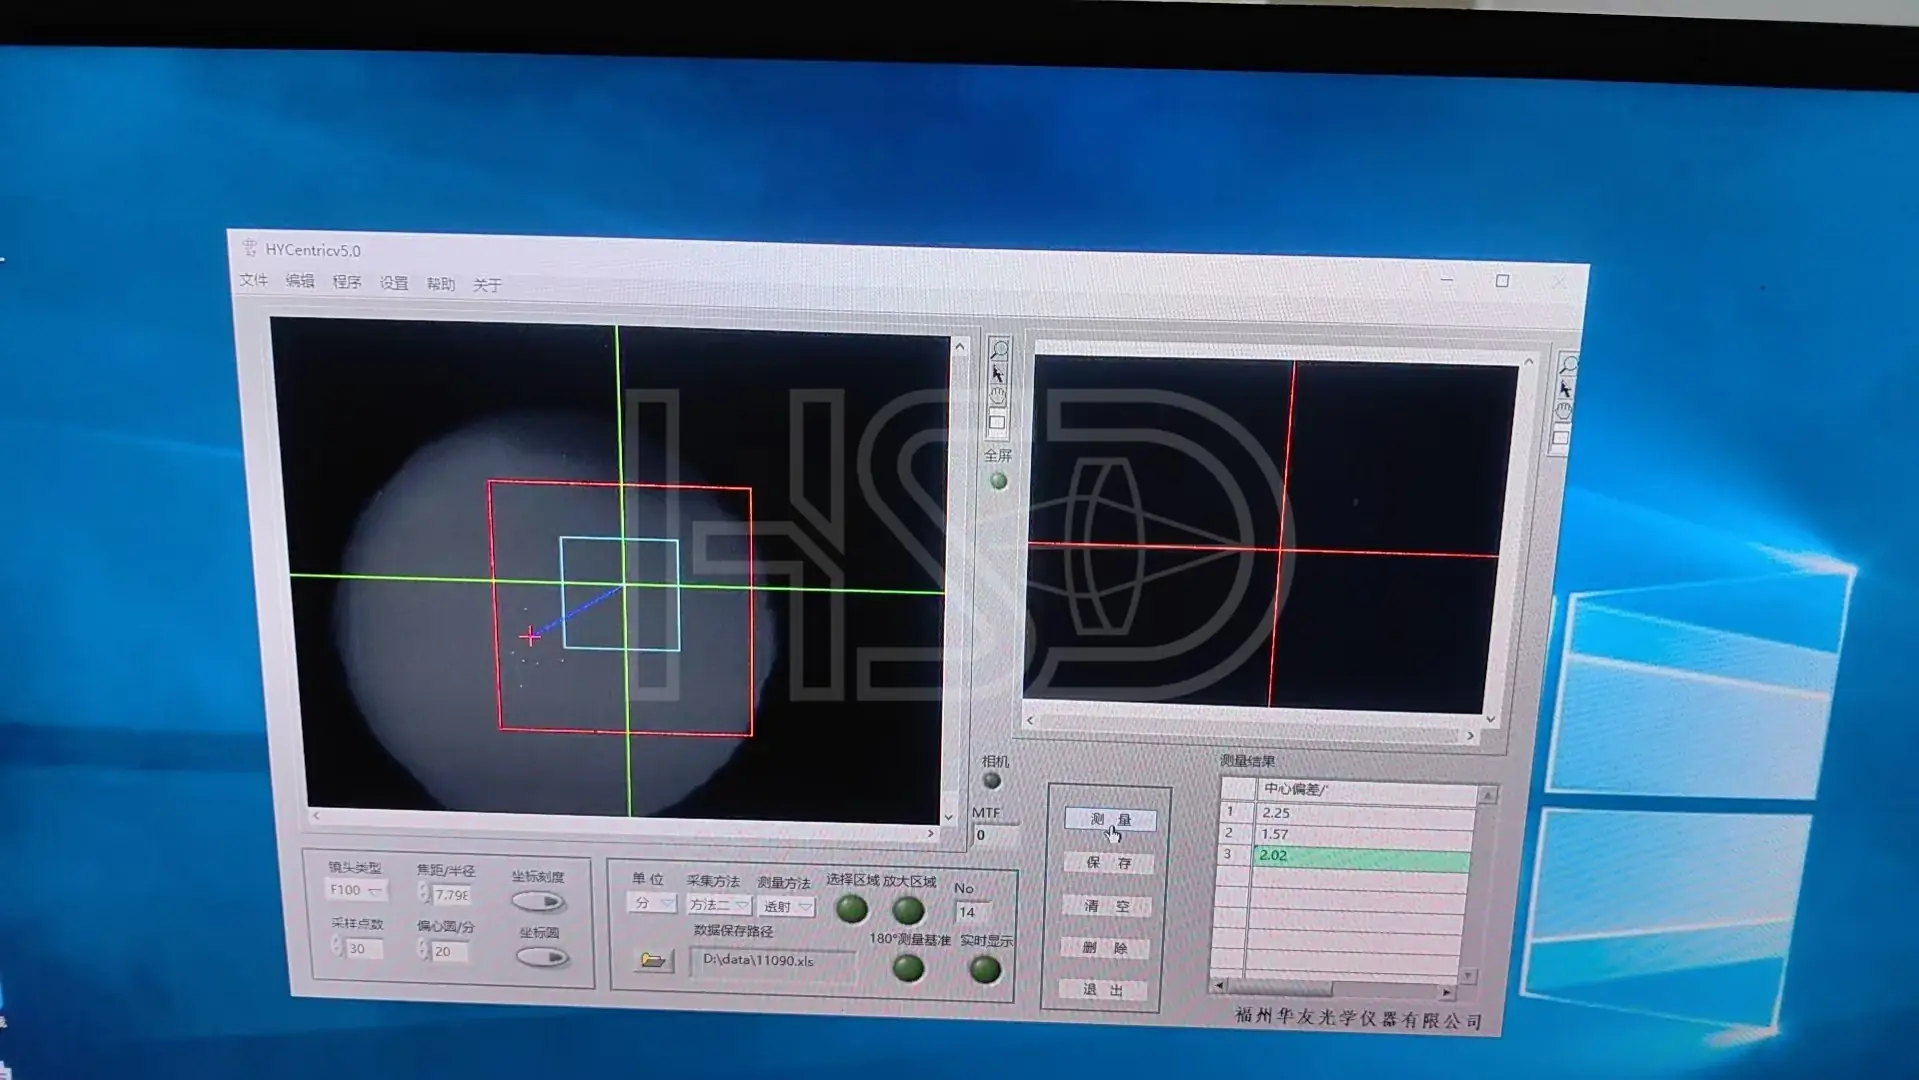
Centration checked on the centration station, typically ≤3′. The reading shown is from a real part — 2.02′.
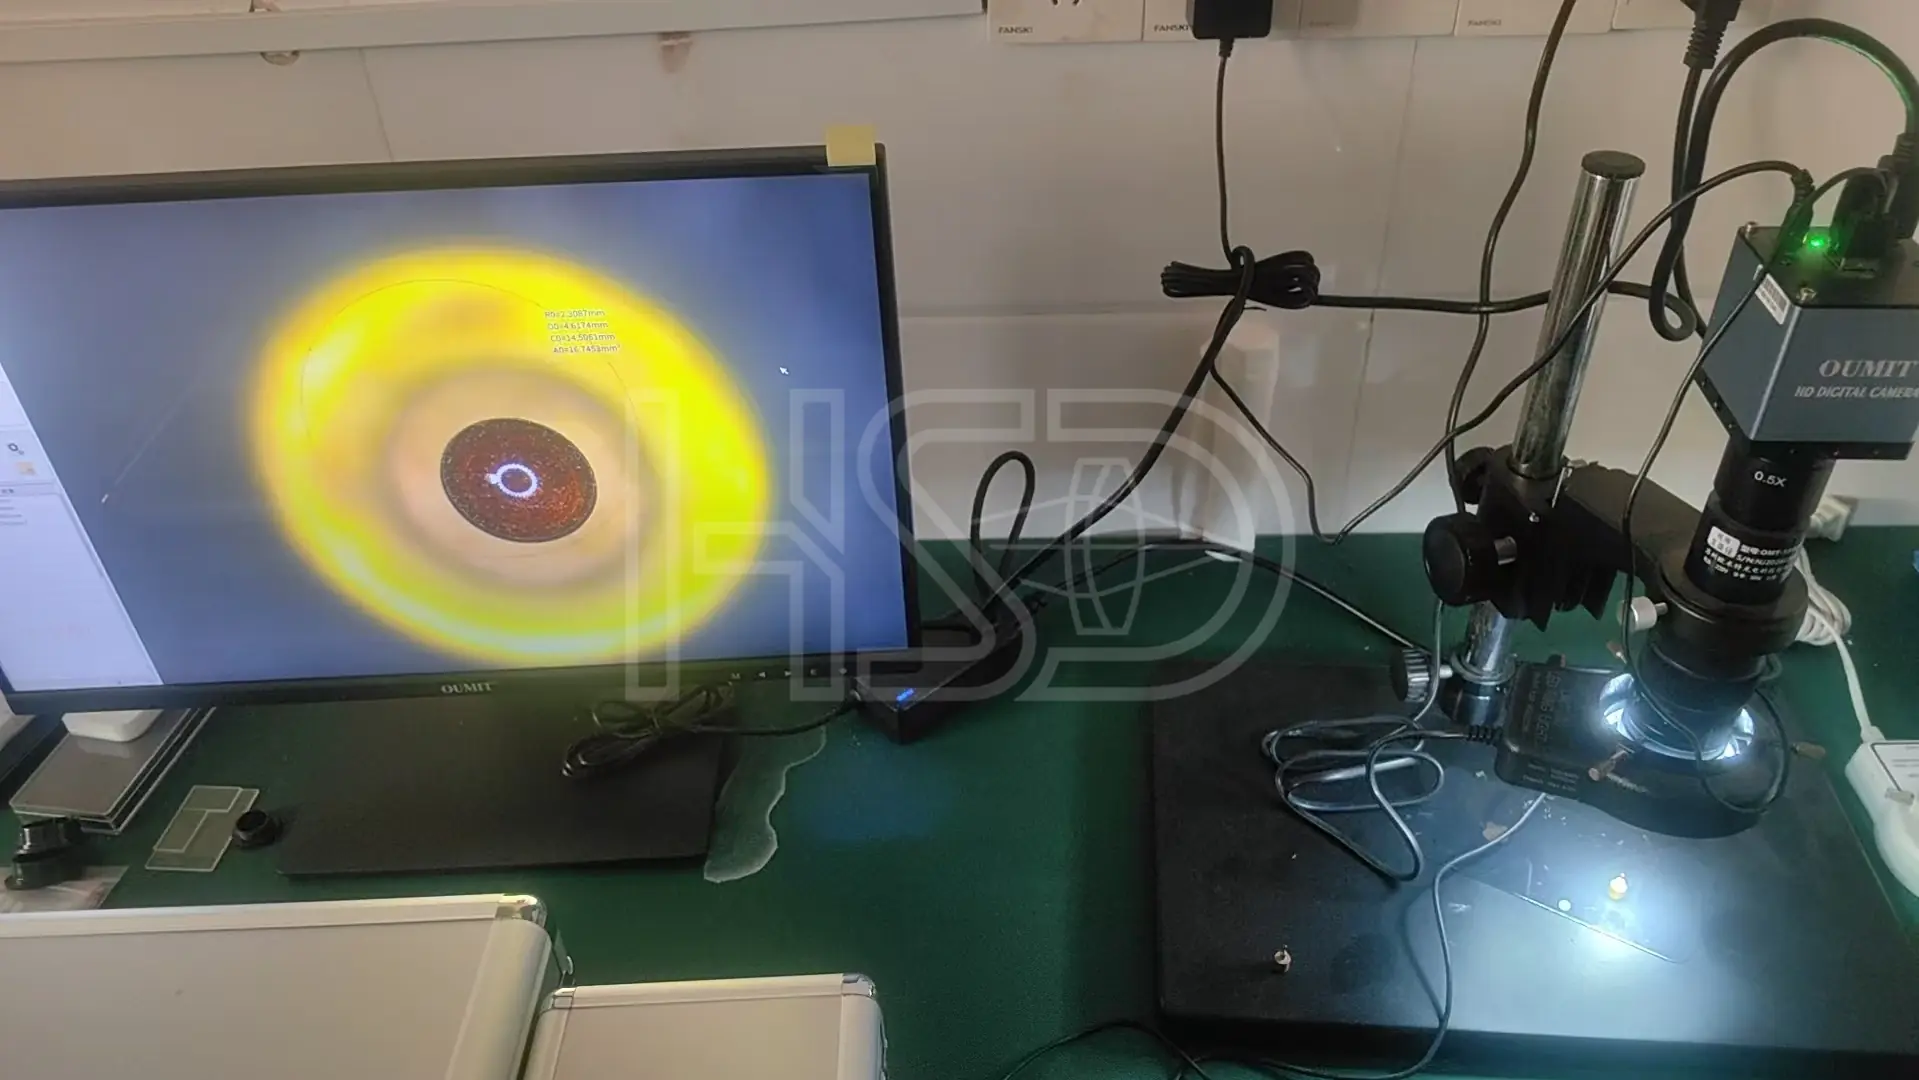
Surface and edge quality inspected under a video microscope — scratch/dig per MIL-PRF-13830B.
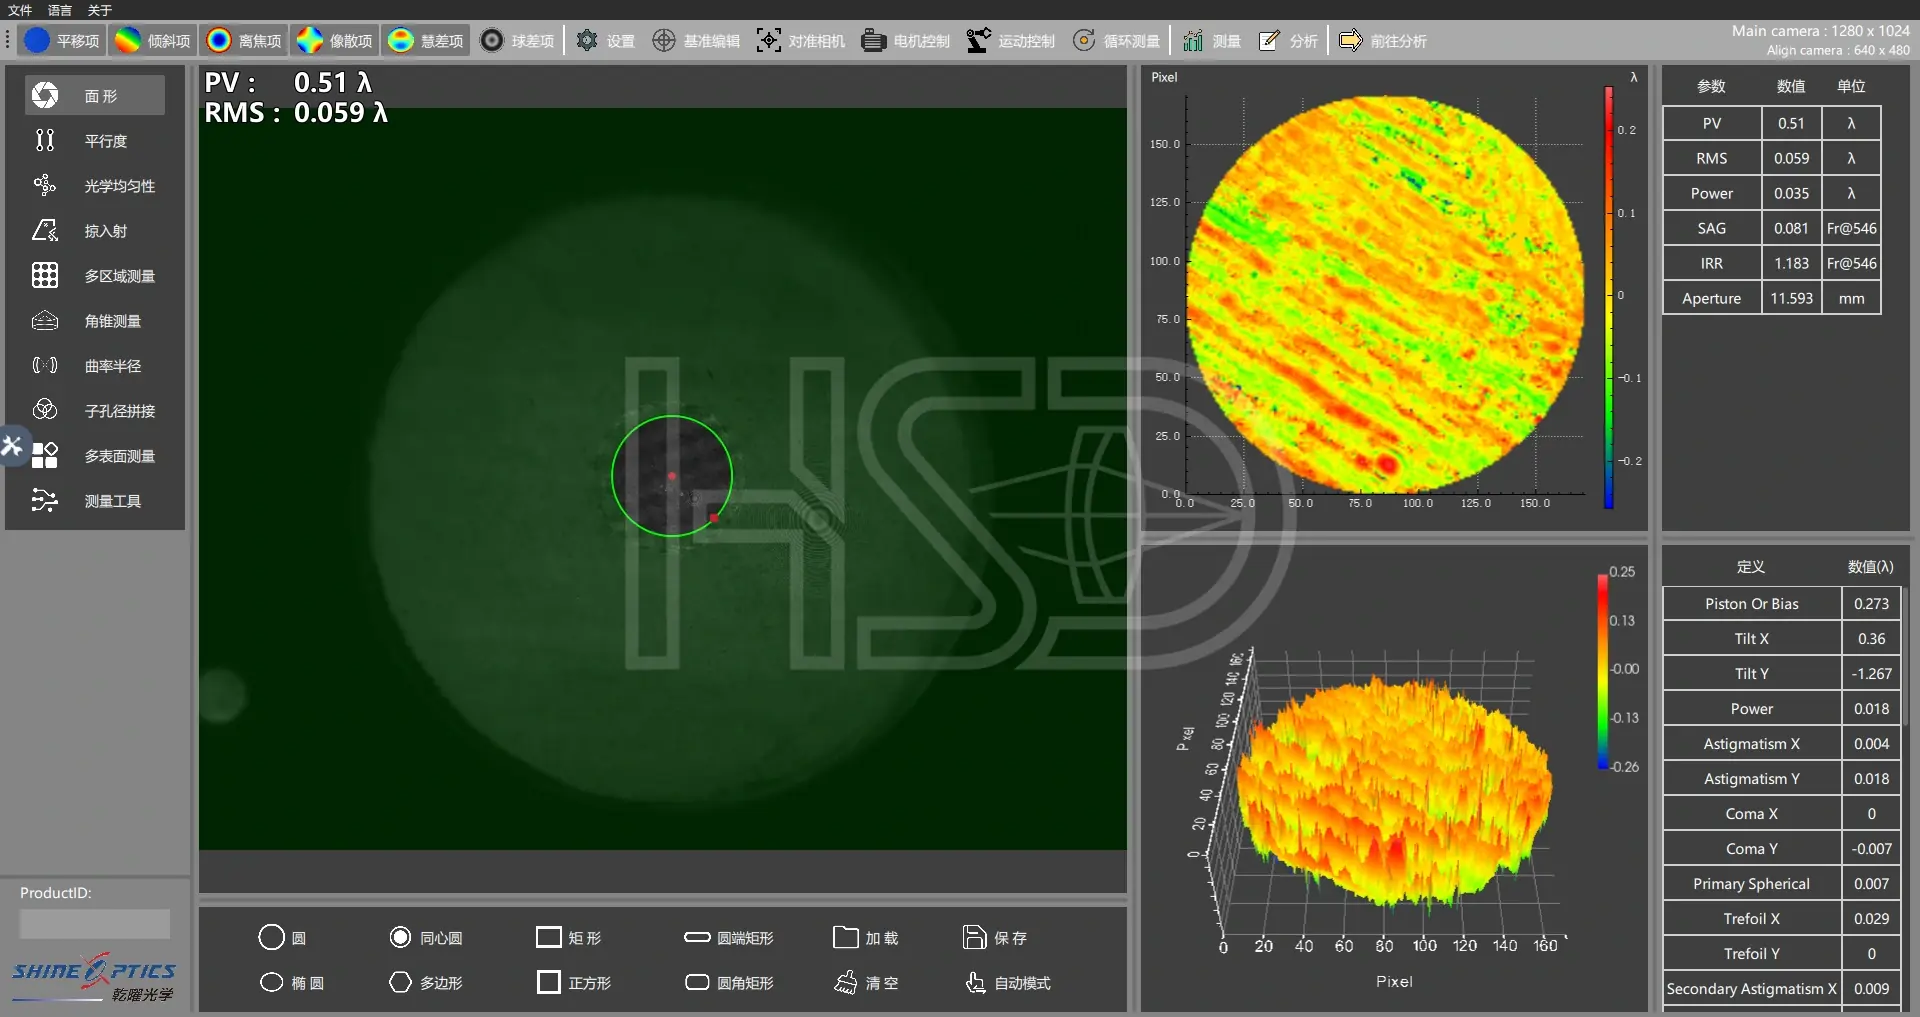
A passing surface from a production run: PV 0.51λ, RMS 0.059λ. Rejects never leave the workshop.
Measured COA per batch — ask for a sample COA with your quote. · Learn how to read a surface map →
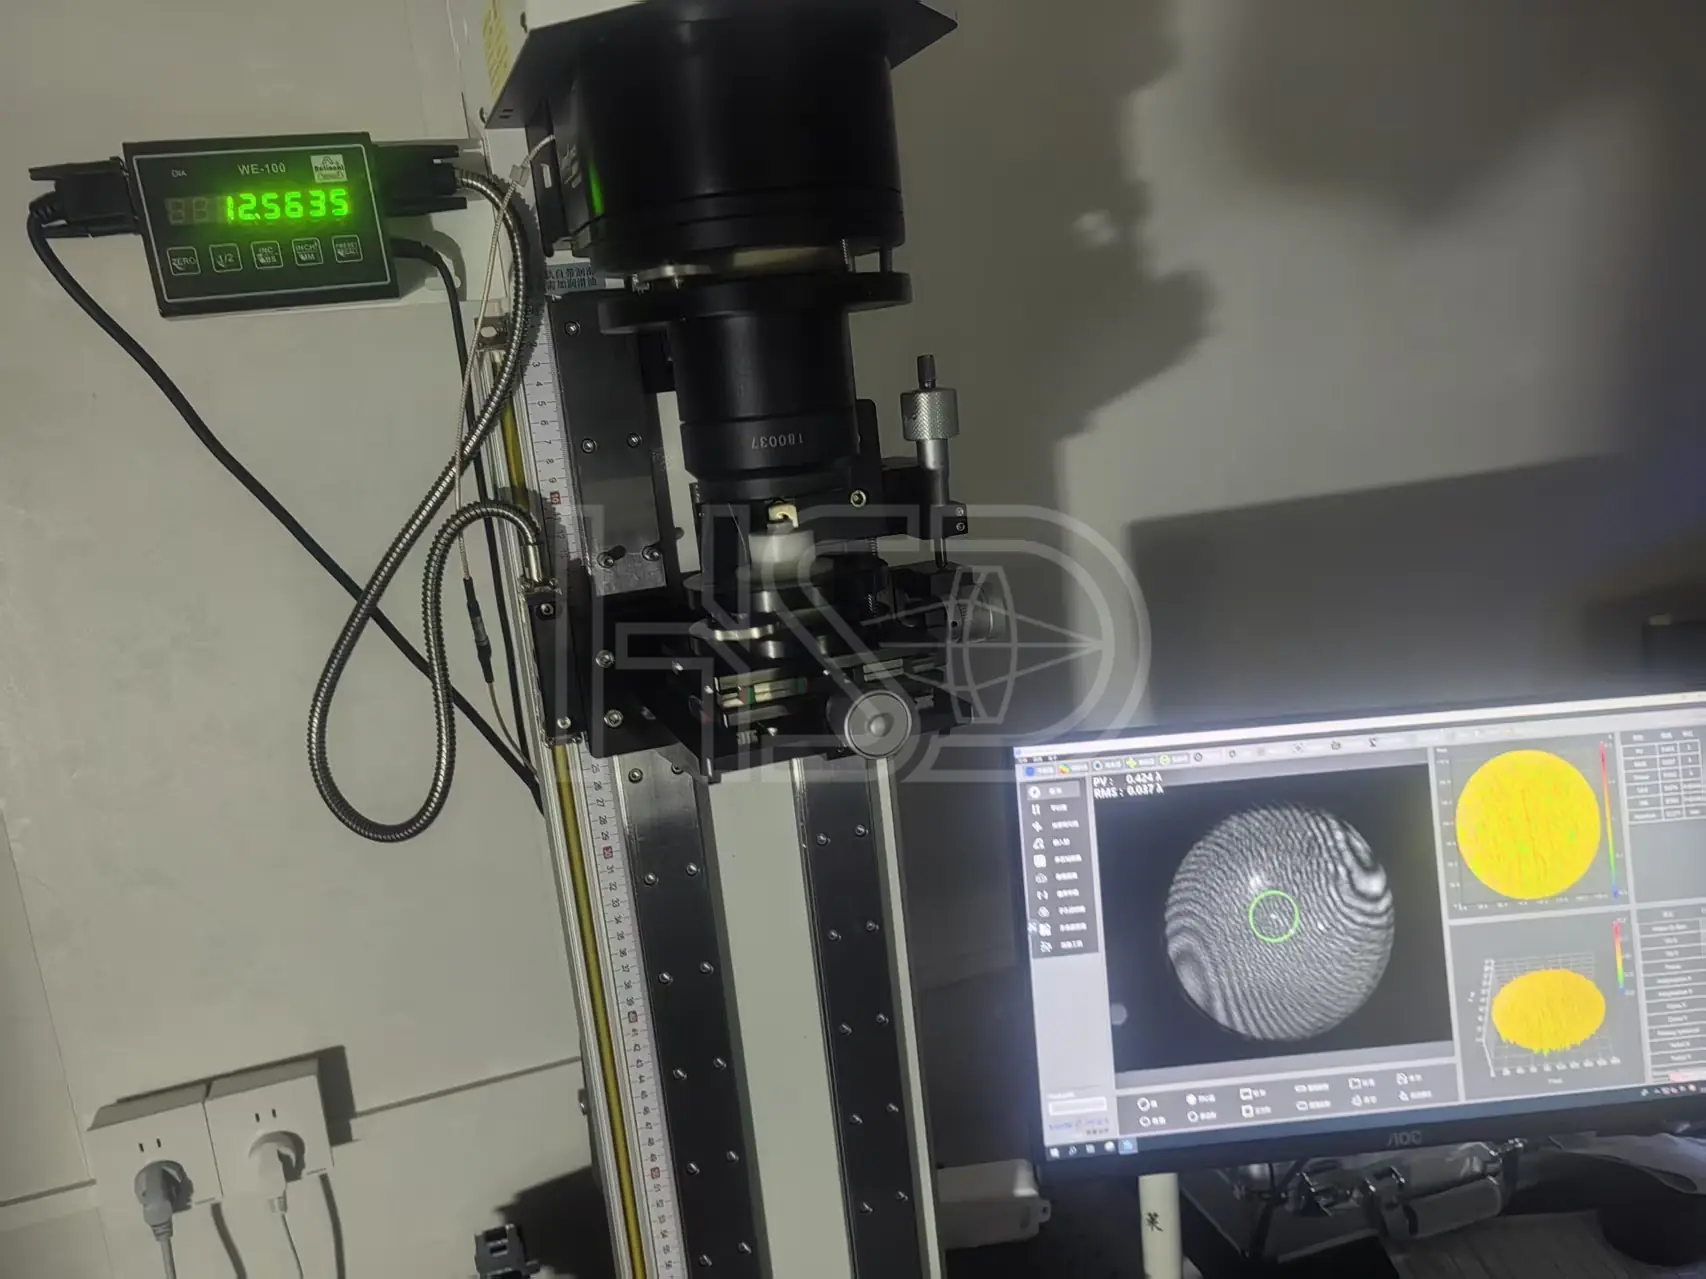
Interferometer workstation — a PV 0.424λ surface under test.
Real measurement, kept on file. Your COA gets the same kind of data.
Watch rod lens grinding, polishing, centration measurement and final inspection in real time. All information shared during the tour is confidential — your NDA is welcome.
Schedule a Live Video Tour